Edit Your Comment
USD/JPY
Member Since Dec 11, 2015
1487 posts
Mar 09, 2016 at 11:26
Member Since Dec 11, 2015
1487 posts
The trend is bearish in general, but that won't be confirmed before it breaks below the previous low at 110.97.
Member Since Nov 19, 2014
169 posts
Mar 10, 2016 at 05:14
Member Since Nov 19, 2014
169 posts
Hey all,
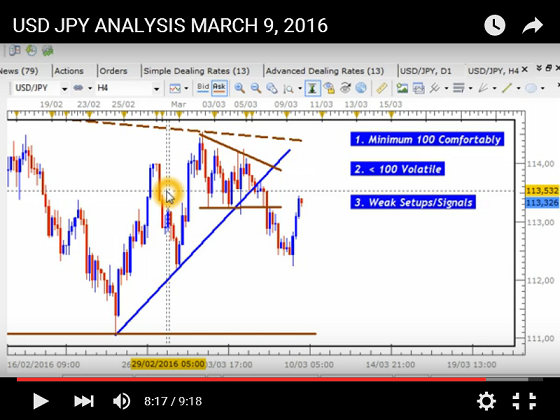
This Sharp Reversal on the USD JPY yesterday would have taken my Stop Loss had I traded it..
It was a tempting setup but there were some important reasons that caused this reversal and led me to avoid this one

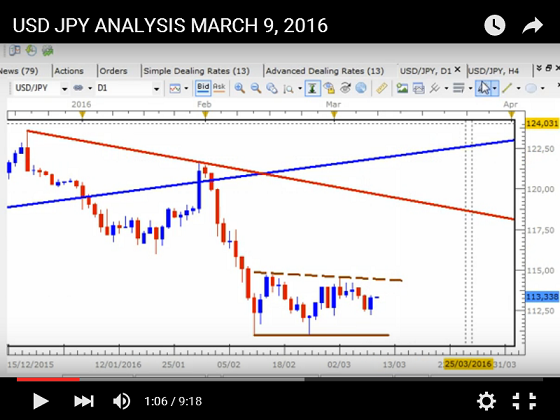
These types of trades can be tempting especially when the 4 H Chart offers 100 Pips. But what I find is that targets of less than 100 Pips or 100 Pips exactly tend to be associated with weak setups and signals. So even though the 4 H had strong Bearish Signals, the Signal on the Daily Chart was weak. This usually leads to volatility and reversals on the lower time frames.

As you can see, the last Bearish Candle was fairly weak compared to those that normally lead to strong moves such as those that led to the strong downtrend on the left hand side of the chart.
Key is to always keep an eye on the Daily Chart despite how strong the signals on the 4 H Chart maybe.
This Sharp Reversal on the USD JPY yesterday would have taken my Stop Loss had I traded it..
It was a tempting setup but there were some important reasons that caused this reversal and led me to avoid this one

These types of trades can be tempting especially when the 4 H Chart offers 100 Pips. But what I find is that targets of less than 100 Pips or 100 Pips exactly tend to be associated with weak setups and signals. So even though the 4 H had strong Bearish Signals, the Signal on the Daily Chart was weak. This usually leads to volatility and reversals on the lower time frames.

As you can see, the last Bearish Candle was fairly weak compared to those that normally lead to strong moves such as those that led to the strong downtrend on the left hand side of the chart.
Key is to always keep an eye on the Daily Chart despite how strong the signals on the 4 H Chart maybe.
Trade Less, Earn More
Member Since Dec 11, 2015
1487 posts
Mar 16, 2016 at 10:29
Member Since Dec 11, 2015
1487 posts
Right now it's just a tight range, I'm not opening new positions before a proper break out in either direction.
Member Since Oct 02, 2014
909 posts
Mar 21, 2016 at 07:11
Member Since Sep 20, 2012
9 posts
Usdjpy plays the range, consolidation pattern 110.80-114.60
Strong resistance at 120.40
Support level below the lowest price will target level at 106.00 area, as long as the usdjpy stay above 106 meaning the bullish trend didn’t over yet, but keep staying below 114.60 is not a good sign
Moving above 114.60 will lead to 116.40 resistance while crossing this level could give us the 118.20 area
Member Since Dec 11, 2015
1487 posts
Mar 22, 2016 at 10:00
Member Since Dec 11, 2015
1487 posts
It's still consolidating around that level, but it will break above it, I think.
Member Since Oct 02, 2014
909 posts
Member Since Mar 28, 2016
93 posts
Mar 29, 2016 at 06:11
Member Since Mar 28, 2016
93 posts
The USDJPY had a bullish momentum last week after a failure to make a clear break below 110.96 as you can see on my daily chart below, topped at 113.32 and hit 113.55 earlier today. The bias remains bullish in nearest term testing 114.50, which is a good place to sell with a tight stop loss as a clear break and daily close above 114.50 could trigger further bullish scenario testing 116.00 or higher. Immediate support is seen around 113.00. A clear break below that area could lead price to neutral zone in nearest term testing 112.50/35 area.
Member Since Oct 02, 2014
909 posts
Member Since Oct 02, 2014
909 posts
Apr 05, 2016 at 10:25
Member Since Sep 20, 2012
9 posts
let's check usdjpy technical analysis
USD/JPY's recuperation was constrained at 113.81 a week ago, just underneath specified 113.81 resistance, and switched. Further, fall would be seen for this present week for retesting 110 first and then to 108 area
my viewpoint will stay bearish as long as the usdjpy stay below 113.81. In any case, break of this resistance will show close term inversion and turn viewpoint bullish.
In the master plan, value activities from 125.85 medium term top are forming into a more profound revision. Break of 106 resistance is should have been the primary indication of fruition of the trend.
pattern consolidation suggests also that break of 110.50 will bring the next level to 108 area

*Commercial use and spam will not be tolerated, and may result in account termination.
Tip: Posting an image/youtube url will automatically embed it in your post!
Tip: Type the @ sign to auto complete a username participating in this discussion.


