


DRFX TRADING SERVICE 2017 (By DRFXTRADING)
The user has deleted this system.
DRFX TRADING SERVICE 2017 Discussion
Nov 18, 2016 at 21:43
634 Views
8 Replies

Member Since Nov 19, 2014
169 posts
Dec 26, 2016 at 23:27
(edited Dec 26, 2016 at 23:55)
Hey Traders,
This is a continuation of the Swing Trading strategy I have been trading for some time. You can see the thread for it here https://www.myfxbook.com/community/experienced-traders/swing-trading-analysis--results/944177,1 and the previous system here https://www.myfxbook.com/members/DRFXTRADING/aggressive-swing-trading/1474786
SWING TRADING
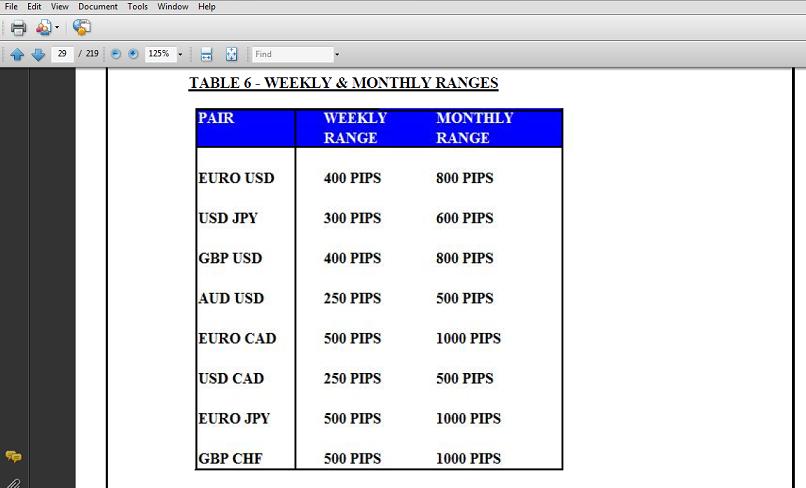
Swing Trading involves targeting the larger ranges of Currency Price movements that take place across the Forex each week. These movements can be anywhere from 200 Pips to 500 Pips and can provide significant profitability for traders every month.
Trading is typically done on the 4 Hour Chart and higher, where the Candlestick Patterns and Signals are a lot more reliable. The Methodology seeks to take advantage of these and other advantages of Swing Trading to target High Probability Trades.
METHODOLOGY
The trades that you will see here are based on a Price Action strategy that utilizes the most accurate Candlestick Patterns and Signals on the Daily and 4 Hour Charts. The main aspects of the Methodology are;
Identification of Market Direction using Candlestick Patterns;
Using the Daily & 4 Hour Charts for Entry Signals & Stop Placement;
Aiming for 100 to 200 Pips Per Trade;
Keeping Trades open for a Pre-Determined Holding Period (2-7 Days);
Never Actively Monitoring the Trades - 'Setting It and Forgetting It';
Targets of 100 to 200 Pips has been found to be ideal for Swing Trading. Trades that offer less than 100 Pips are associated with volatile market conditions, making them low probability trades. Holding out for more than 200 Pips tends to be risky as the market usually reverses or slows down beyond this level. The Holding Periods that established depend on the type of setup being traded and the average time the market takes to reach the targets for these setups, without the need to monitor the trades.
TRADING TARGET
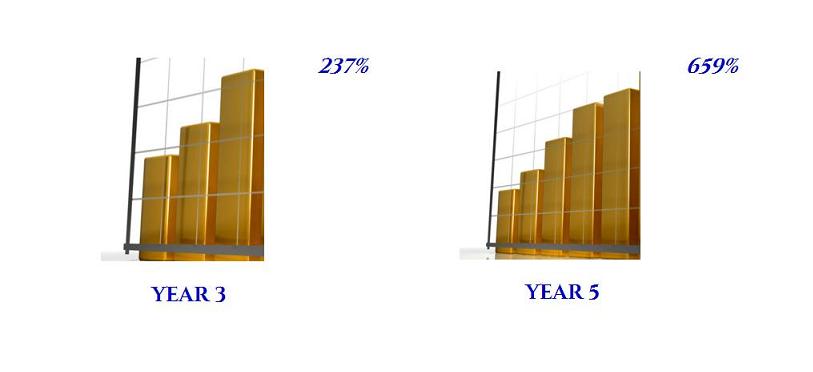
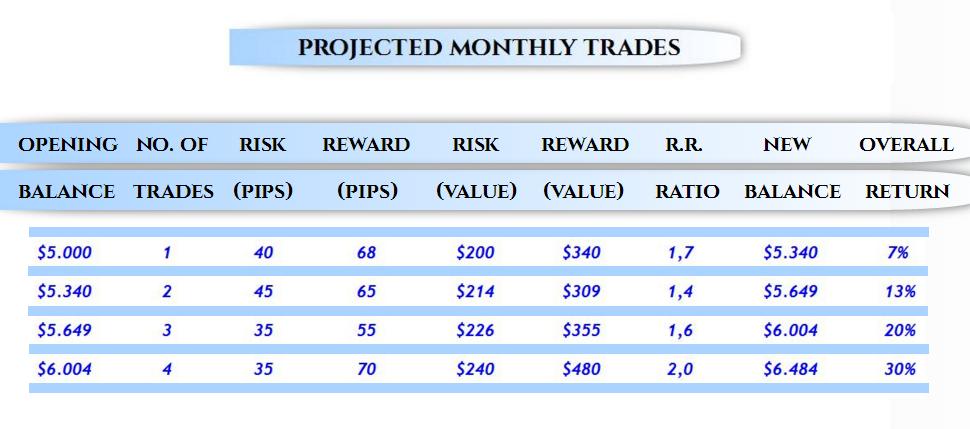
Every year, I aim to achieve a target of at least 100% Rate of Return. I think that if you can achieve these results within a Year as a Swing Trader who doesnt want/have the time to stay glued to the market, youll put yourself in a good position Long-Term.
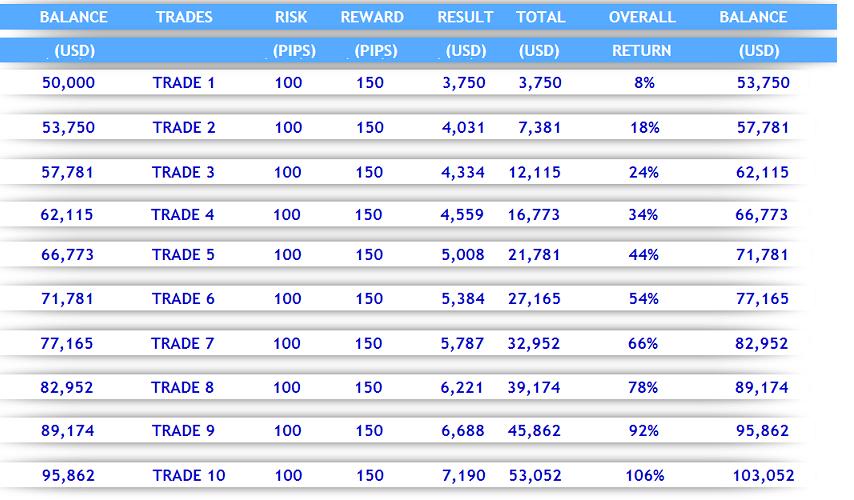
On average, my Stop Losses are 100 Pips, using a 5% Risk Per Trade. The table above assumes an average gain of 150 Pips. So the idea is that you only trade a few times a month to target the best setups, that have the Highest Probability of success.
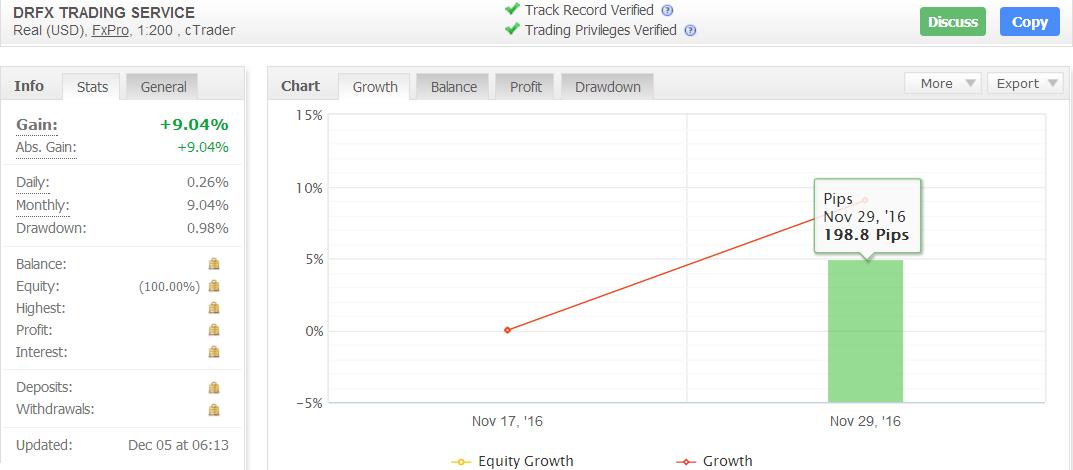
Heading into the 2016/2017 period, I am now up 9.0% after one trade of 198 Pips on the NZD JPY that you can see in the video below.
So assuming normal conditions, would now need 9 Trades to hit that target. Of course, trading losses are expected along the way, but it is expected that once the market remains liquid, will not take long to reach that goal...and more.
Duane
DRFXSWINGTRADING
This is a continuation of the Swing Trading strategy I have been trading for some time. You can see the thread for it here https://www.myfxbook.com/community/experienced-traders/swing-trading-analysis--results/944177,1 and the previous system here https://www.myfxbook.com/members/DRFXTRADING/aggressive-swing-trading/1474786
SWING TRADING
Swing Trading involves targeting the larger ranges of Currency Price movements that take place across the Forex each week. These movements can be anywhere from 200 Pips to 500 Pips and can provide significant profitability for traders every month.
Trading is typically done on the 4 Hour Chart and higher, where the Candlestick Patterns and Signals are a lot more reliable. The Methodology seeks to take advantage of these and other advantages of Swing Trading to target High Probability Trades.
METHODOLOGY
The trades that you will see here are based on a Price Action strategy that utilizes the most accurate Candlestick Patterns and Signals on the Daily and 4 Hour Charts. The main aspects of the Methodology are;
Identification of Market Direction using Candlestick Patterns;
Using the Daily & 4 Hour Charts for Entry Signals & Stop Placement;
Aiming for 100 to 200 Pips Per Trade;
Keeping Trades open for a Pre-Determined Holding Period (2-7 Days);
Never Actively Monitoring the Trades - 'Setting It and Forgetting It';
Targets of 100 to 200 Pips has been found to be ideal for Swing Trading. Trades that offer less than 100 Pips are associated with volatile market conditions, making them low probability trades. Holding out for more than 200 Pips tends to be risky as the market usually reverses or slows down beyond this level. The Holding Periods that established depend on the type of setup being traded and the average time the market takes to reach the targets for these setups, without the need to monitor the trades.
TRADING TARGET
Every year, I aim to achieve a target of at least 100% Rate of Return. I think that if you can achieve these results within a Year as a Swing Trader who doesnt want/have the time to stay glued to the market, youll put yourself in a good position Long-Term.
On average, my Stop Losses are 100 Pips, using a 5% Risk Per Trade. The table above assumes an average gain of 150 Pips. So the idea is that you only trade a few times a month to target the best setups, that have the Highest Probability of success.
Heading into the 2016/2017 period, I am now up 9.0% after one trade of 198 Pips on the NZD JPY that you can see in the video below.
So assuming normal conditions, would now need 9 Trades to hit that target. Of course, trading losses are expected along the way, but it is expected that once the market remains liquid, will not take long to reach that goal...and more.
Duane
DRFXSWINGTRADING
Attachments:
Trade Less, Earn More
Member Since Nov 19, 2014
169 posts
Dec 28, 2016 at 23:45
Should we always Demo Trade before going on to Live Trading or should we jump in to get a feel for the market?
I think Demo Trading is fundamental to Live Trading success. Just like other areas of life, if you dont prepare adequately in the simulated environment ....

...you will not be successful.
This is why Demo Accounts were created. Because of how difficult this market is, achieving Profitability with fake money is the only guarantee you will do so with Real Money. Otherwise, Disaster awaits.
Duane
DRFXSWINGTRADING


I think Demo Trading is fundamental to Live Trading success. Just like other areas of life, if you dont prepare adequately in the simulated environment ....
...you will not be successful.
This is why Demo Accounts were created. Because of how difficult this market is, achieving Profitability with fake money is the only guarantee you will do so with Real Money. Otherwise, Disaster awaits.
Duane
DRFXSWINGTRADING
Attachments:
Trade Less, Earn More
Member Since Nov 19, 2014
169 posts
Dec 29, 2016 at 15:47
Recommended Approach to Forex and Swing Trading
1. Establish how much you want to earn from the Forex - in % and $ terms.
2. Determine if you want to be able to earn that every 6 Months, Year, 2 Years Etc.
3. Aim to get that target on a Demo with a CLEAR set of rules as part of a PROFITABLE Strategy.
4. Use that Strategy for a Minimum of 6 Months to ensure it can work under several market conditions..
5. Go Live and continue to follow the rules and guidelines of your Strategy
Duane
DRFXSWINGTRADING
www.drfxswingtrading.com
Trade Less, Earn More
Member Since Nov 19, 2014
169 posts
Jan 03, 2017 at 20:32
(edited Jan 03, 2017 at 20:34)
PREDICTING MARKET REVERSAL USING THE DAILY CHART
THIS IS THE KEY TO SUCCESS ACROSS ALL TIME FRAMES, NO MATTER YOUR TRADING STRATEGY
Time and time again as a Day Trader years ago, I used to be surprised by sharp reversals that came out of nowhere. There was even a month I had only one successful trade out of about 32 trades because of these moves. It was only when I realized that the Daily Chart and certain types of Signals controlled the trends and setups across the lower charts. If we cant predict these moves based on these signals, we will end up with trading losses from these reversals.
Even though I now preach about Swing Trading as the better approach (www.drfxswingtrading.com), I STRONGLY encourage Day Traders and Scalpers to learn about these higher charts. Because how much they affect the smaller time frames with certain types of Candlestick Patterns, being aware of whats happening there - separating weak from reliable signals- will have a big impact on your trading.
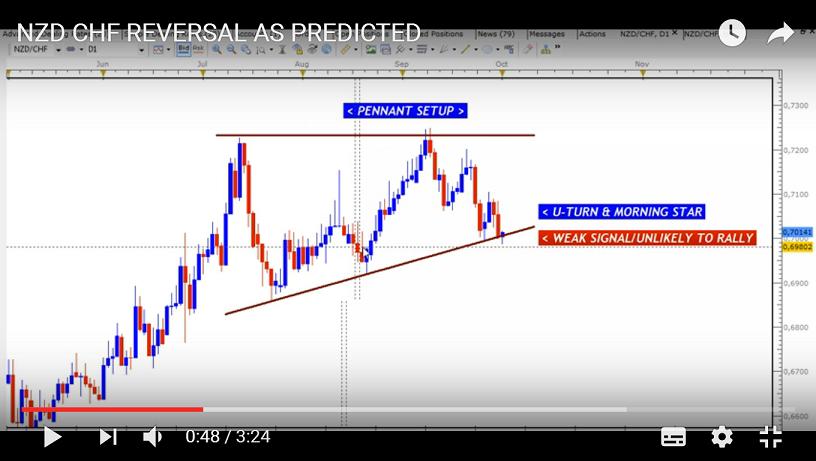
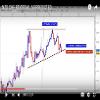
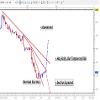
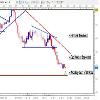
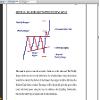
Take this NZD CHF Daily Chart of September 27, 2016 as an example.
The Bull Candle on the Daily Chart indicates many people had started/were about to start trading Long.
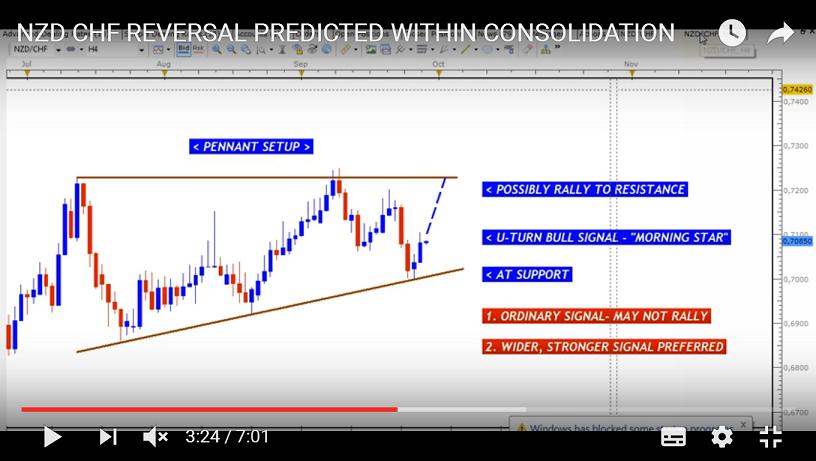
As you can see in the chart above and the video below, I clearly warned about the weakness of this Candle given the size of the Consolidation.
Eventually, the market did pull back as suspected and would have led to losses for those traders who were already long.
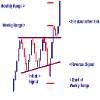
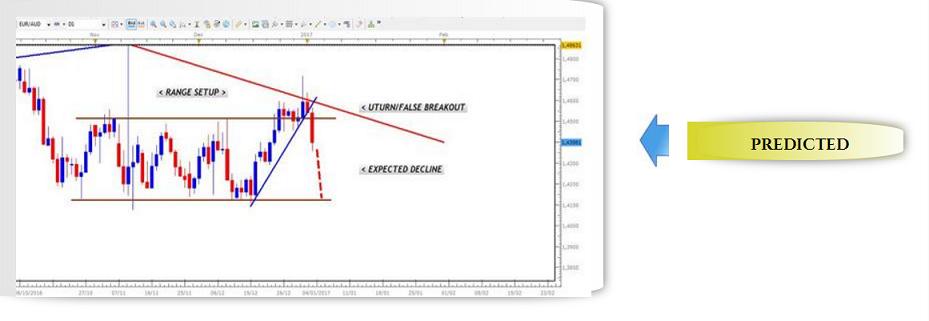
Now taking a look at the situation on the EURO AUD which could provide a trading opportunity tomorrow. We can now see that it is clearly telling us that a bearish move is going to continue because of the Bear Signal at the Top of the Range.

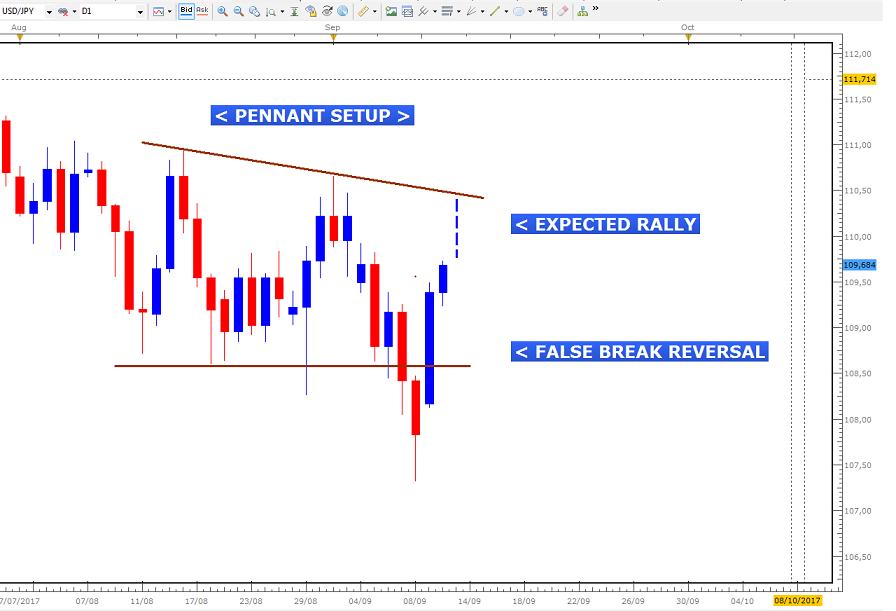
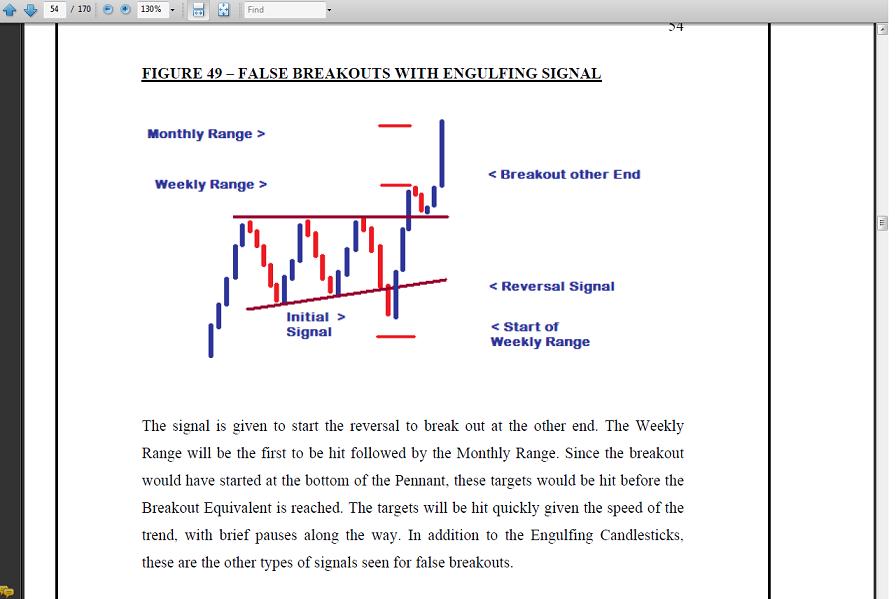
This is based on the theory of False Breakouts for Consolidations where a failed attempt at one end usually leads to a move back inside.
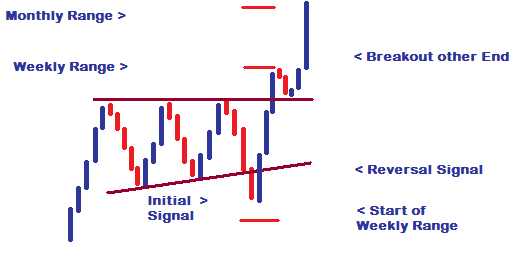
But instead of looking for a Bearish Setup, the bullish pullback on the 30 M could easily lead us to think , we should start going Long.
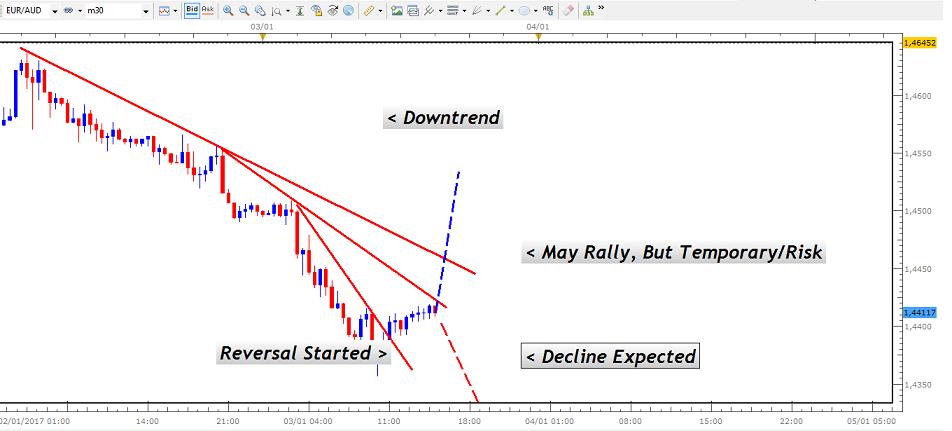
This is one of the tricky things about the market. What may look like the start of a new trend on the small charts could actually be a temporary pullback before the market resumes its main direction.
So knowing how the Daily Charts work and how they determine market direction is VERY important to knowing when, where and how to trade. Even if you use Statistical Indicators, this knowledge will be the deciding factor when making a decision based on indicators that sometimes give conflicting readings.
As a Day Trader or Scalper, you`ll know with greater certainty exactly how many Pips are possible in a particular direction or whether its worth the risk trading in that direction.
Duane
DRFXSWINGTRADGING.
Attachments:
Trade Less, Earn More
Member Since Nov 19, 2014
169 posts
Jan 17, 2017 at 07:58
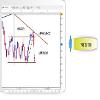
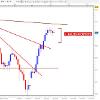
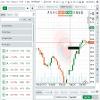
TRADE UPDATE EURO AUD
Hey Traders,
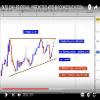
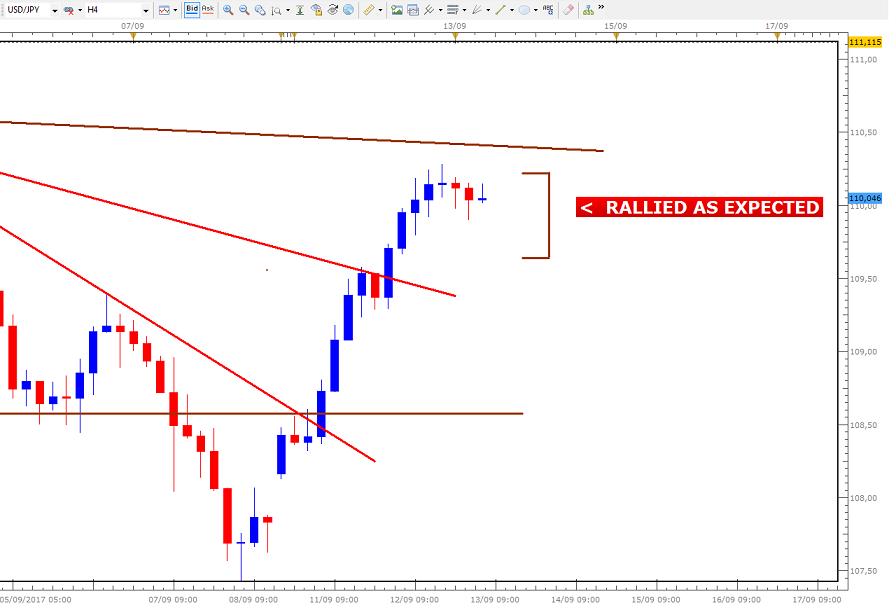
As predicted, the EURO AUD declined to the Range Support as it Reversed Sharply back inside of the Daily Range.
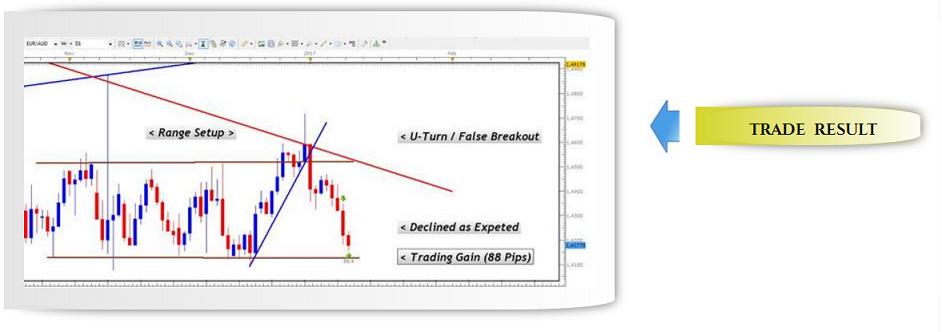
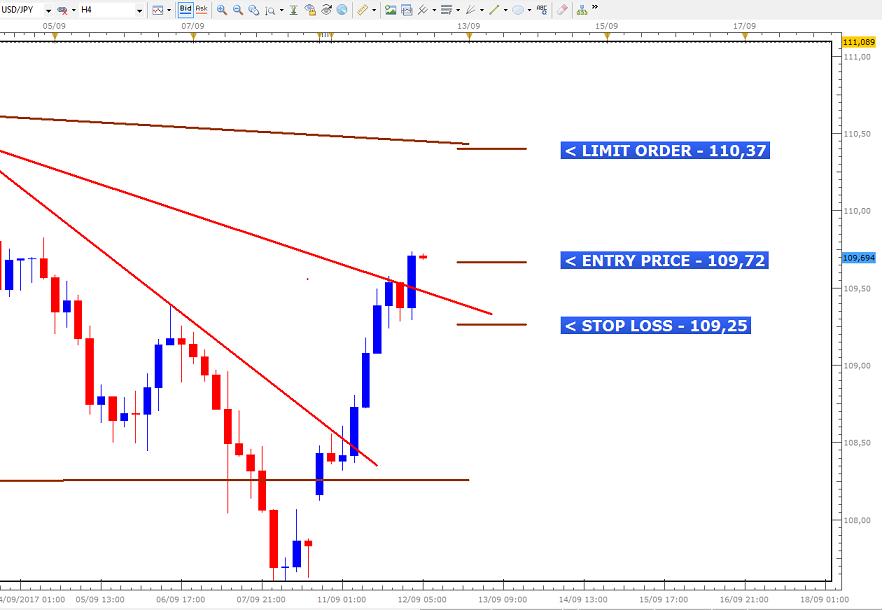
This was the Setup on the 4H Chart to take advantage of this bearish move.
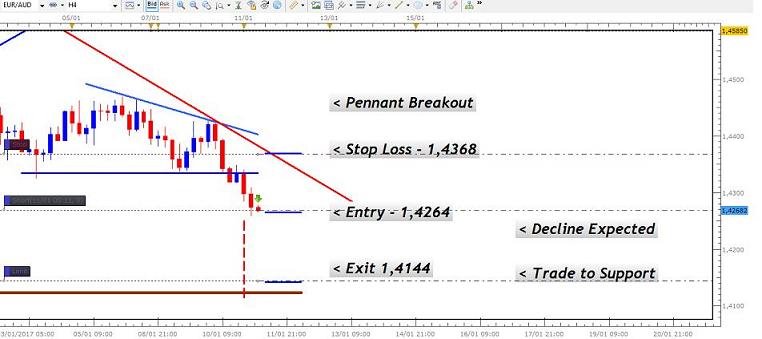
After around 36 hours, trade gave 88 Pips in gains.
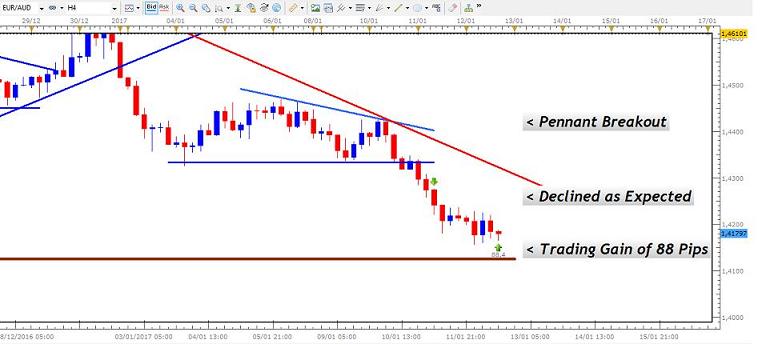
As you will see described here (www.drfxswingtrading.com), the trade was based on the theory behind False Breakouts. Often times we can get caught trading in the wrong direction of Breakout, but if we lose going one way, we can make up for it going the other way.
Duane
DRFXSWINGTRADING
Hey Traders,
As predicted, the EURO AUD declined to the Range Support as it Reversed Sharply back inside of the Daily Range.
This was the Setup on the 4H Chart to take advantage of this bearish move.
After around 36 hours, trade gave 88 Pips in gains.
As you will see described here (www.drfxswingtrading.com), the trade was based on the theory behind False Breakouts. Often times we can get caught trading in the wrong direction of Breakout, but if we lose going one way, we can make up for it going the other way.
Duane
DRFXSWINGTRADING
Attachments:
Trade Less, Earn More
Member Since Nov 19, 2014
169 posts
Jan 17, 2017 at 08:02
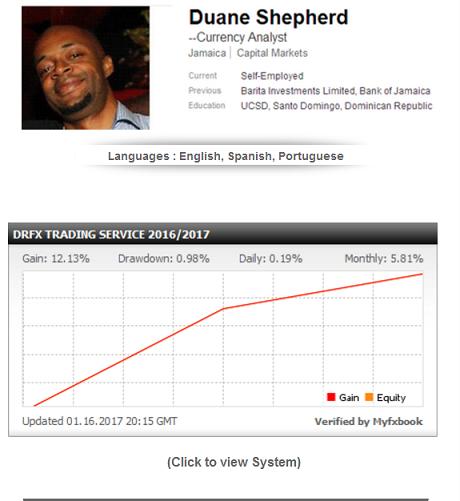
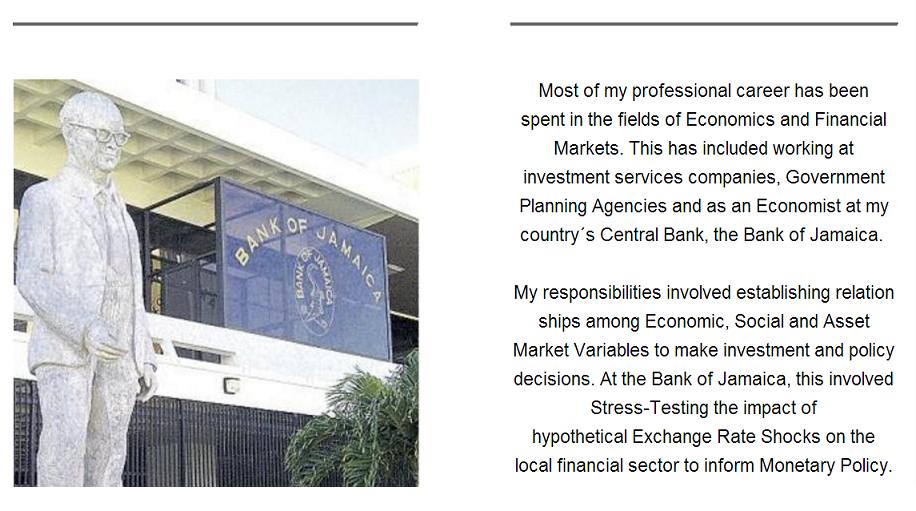
Hey all,
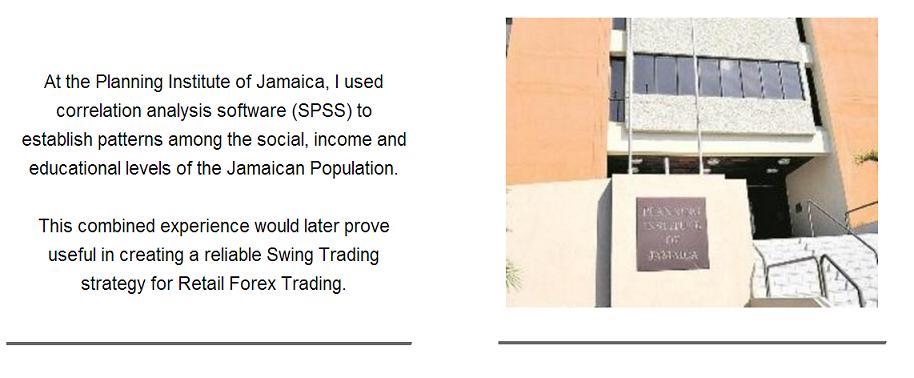
Its funny. We all are here chatting with each other in various threads but dont know much about who we´re really talking to. So here is a little background of my work experience before Forex Trading. I believe my Research jobs in Economics and Finance helped a great deal in being able to create a Forex Swing System thats profitable.
If Central Bank Economists are able to accurately forecast Exchange Rates, it means that the market can be used for personal gain as well. However, the problem with most systems is that they aren´t tested and researched properly. So my goals were to fill that gap left by these systems and make it easy to use - no Statistical Indicators, no Economic Analysis needed.
Attachments:
Trade Less, Earn More
Member Since Nov 19, 2014
169 posts
Jan 22, 2017 at 08:29
Hey Traders,
Another example of using the Larger Time Frames to accurately predict the market. This is the basis of my Swing Trading System.
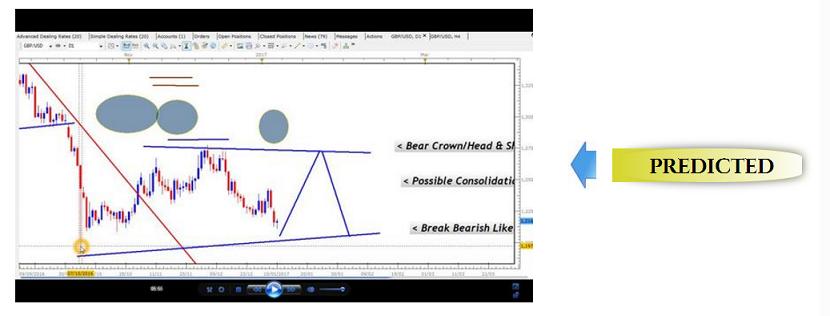
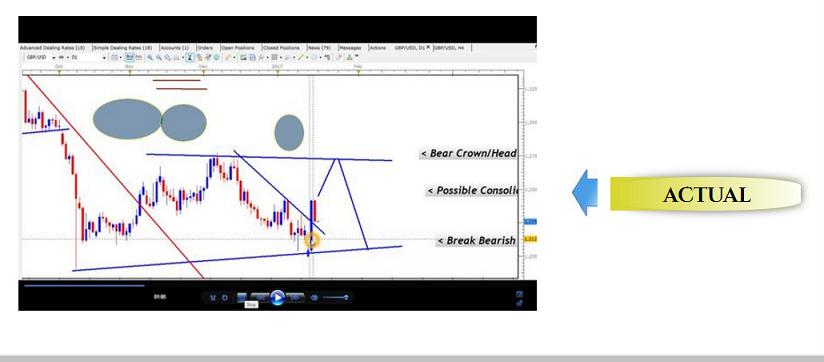
...and the Video that predicted it....
Day Trading is fun, but being able to avoid major volatility while still earning large Returns over the Long-Run...
...is much more enjoyable. This is what is possible with a patient 50% Rate of Return annually.
See more examples here
https://www.drfxswingtrading.com/home.html
Trade Less, Earn More
Duane


Another example of using the Larger Time Frames to accurately predict the market. This is the basis of my Swing Trading System.
...and the Video that predicted it....
Day Trading is fun, but being able to avoid major volatility while still earning large Returns over the Long-Run...
...is much more enjoyable. This is what is possible with a patient 50% Rate of Return annually.
See more examples here
https://www.drfxswingtrading.com/home.html
Trade Less, Earn More
Duane
Attachments:
Trade Less, Earn More
Member Since Nov 19, 2014
169 posts
Feb 03, 2017 at 07:36
Hey Traders,
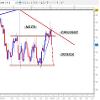
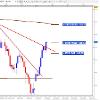
Double Tops, if formed, could give us a trade on the GBP USD Daily Chart within the Consolidation being formed.
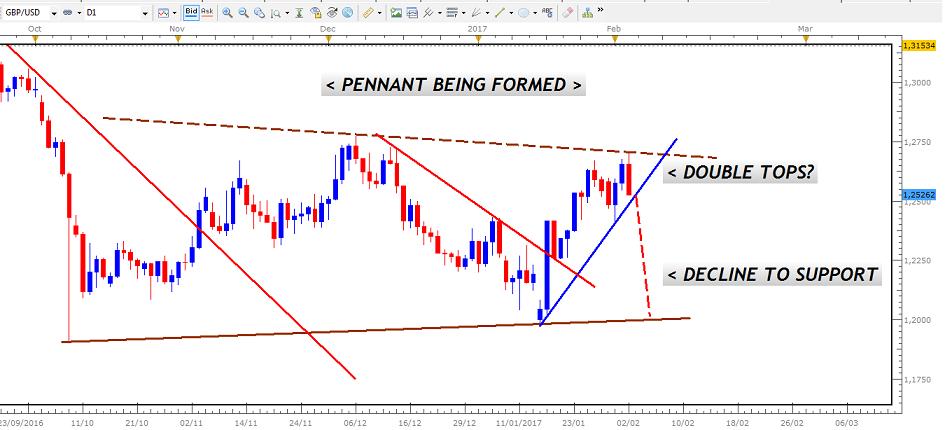
Anybody looking to short this too?
Lets see,
Duane
www.drfxswngtrading.com
Double Tops, if formed, could give us a trade on the GBP USD Daily Chart within the Consolidation being formed.
Anybody looking to short this too?
Lets see,
Duane
www.drfxswngtrading.com
Attachments:
Trade Less, Earn More


*Commercial use and spam will not be tolerated, and may result in account termination.
Tip: Posting an image/youtube url will automatically embed it in your post!
Tip: Type the @ sign to auto complete a username participating in this discussion.


