Swing Trading Analysis & Results

Nov 19, 2014からメンバー
169 投稿
Apr 21, 2015 at 19:50
(編集済みのApr 21, 2015 at 16:50)
This Thread will show how I Analyze and Trade the major Currency Pairs for 100 to 200 Pips per trade.
The Swing Trading approach focuses on the larger time frames of the Daily and 4 Hour Charts where the patterns and signals are more stable relative to the Smaller Time Frames. My main tools include Candlestick Signals, Consolidation Patterns and Trend Lines.
Feel free to share your style of Swing Trading or Day Trading that can provide similar results.
Comments, questions and best of all Criticisms are all welcomed.
Lets get to it.
Duane
N.B. I am not advertising a System nor Soliciting Business. I am simply showing my style of trading according to my Methodology and the results it has provided.
Trade Less, Earn More
Nov 19, 2014からメンバー
169 投稿
Apr 21, 2015 at 19:50
200- PIP AUD NZD TRADE
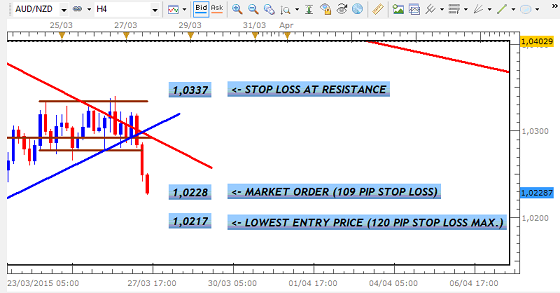
The most recent trade in keeping with this approach was on the AUD NZD. The Setup was a Consolidation Range that broke out short below its Support.
After determining that the overall Setup was in sync with my strategy, the trade was executed with an Entry Setup on the 4 Hour Chart.
After a few days, the target was hit for the preset amount..
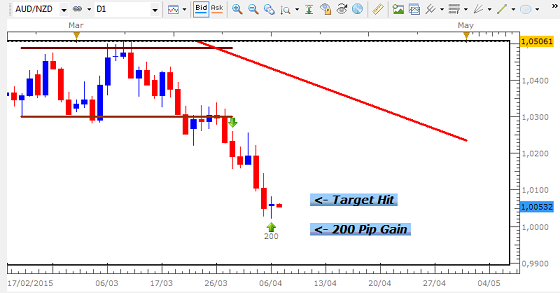
... leading to an increase in the trend of gains so far...
https://www.myfxbook.com/members/DRFXTRADING/duane/1079693
MAIN ASPECTS OF TRADE
- Consolidation Breakout Theory
- Range Setups for Stop Loss Placement
- Holding Trades for a few days
- Correct choice of targets ahead of pullbacks....
The most recent trade in keeping with this approach was on the AUD NZD. The Setup was a Consolidation Range that broke out short below its Support.
After determining that the overall Setup was in sync with my strategy, the trade was executed with an Entry Setup on the 4 Hour Chart.
After a few days, the target was hit for the preset amount..
... leading to an increase in the trend of gains so far...
https://www.myfxbook.com/members/DRFXTRADING/duane/1079693
MAIN ASPECTS OF TRADE
- Consolidation Breakout Theory
- Range Setups for Stop Loss Placement
- Holding Trades for a few days
- Correct choice of targets ahead of pullbacks....
付属品:
Trade Less, Earn More
Nov 19, 2014からメンバー
169 投稿
Apr 22, 2015 at 19:32
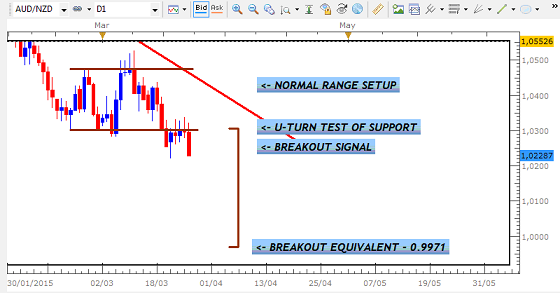
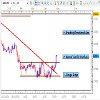
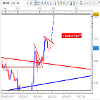
NZD CAD - SHARP FALSE BREAKOUT AHEAD?
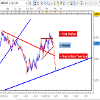
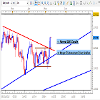
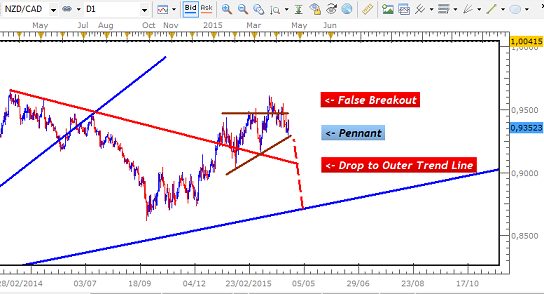
After breaking below its Inner Uptrend Line between June and July of 2014, this pair has since begun a rally above the Downtrend Line that could resume the overall Uptrend. The chart below shows the sharp U-Turn that took place just above its Outer Uptrend Line that led to the break above the Downtrend Line.
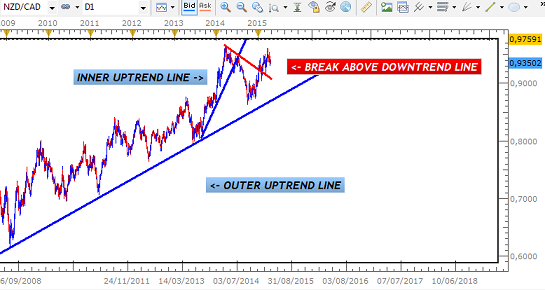
In breaking above this Downtrend Line, the pair then started to lose momentum as it formed a Pennant Setup above this boundary. Eventually, there was an attempted rally above Resistance that would have seen the Kiwi resume its gains against the Yen, but this was short-lived. The market become volatile, taking out those Bullish Candles before pulling back inside of the Pennant near the Support.
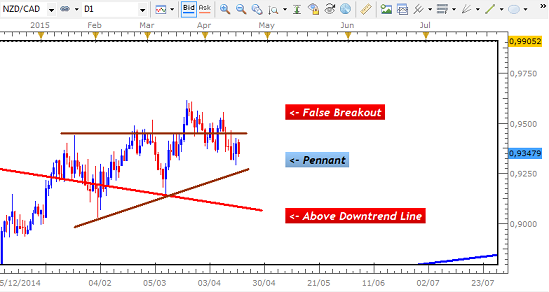
This is in keeping with the theory of False Breakouts and their tendency to move to the other end of the Consolidation.
GBP CAD TRADE
4TH Trade seen here https://www.myfxbook.com/members/DRFXTRADING/duane/1079693
Given the current scenario and the volatile nature of the candles, a larger bearish pullback below the Pennant seems the most likely outcome. Such movements - breaking out at the opposite end of a Consolidation - are also very common following a False Breakout. If this materializes, a sharp drop to the Outer Uptrend Line is likely.

As a Swing Trader using Price Action, the next step will be to wait for the appropriate setups and signals as the pair breaks below the Support and the Downtrend Line. Break below this Downtrend Line will provide added confirmation of this direction, providing the confidence required to capture that next 200-Pip trade.

After breaking below its Inner Uptrend Line between June and July of 2014, this pair has since begun a rally above the Downtrend Line that could resume the overall Uptrend. The chart below shows the sharp U-Turn that took place just above its Outer Uptrend Line that led to the break above the Downtrend Line.
In breaking above this Downtrend Line, the pair then started to lose momentum as it formed a Pennant Setup above this boundary. Eventually, there was an attempted rally above Resistance that would have seen the Kiwi resume its gains against the Yen, but this was short-lived. The market become volatile, taking out those Bullish Candles before pulling back inside of the Pennant near the Support.
This is in keeping with the theory of False Breakouts and their tendency to move to the other end of the Consolidation.
GBP CAD TRADE
4TH Trade seen here https://www.myfxbook.com/members/DRFXTRADING/duane/1079693
Given the current scenario and the volatile nature of the candles, a larger bearish pullback below the Pennant seems the most likely outcome. Such movements - breaking out at the opposite end of a Consolidation - are also very common following a False Breakout. If this materializes, a sharp drop to the Outer Uptrend Line is likely.
As a Swing Trader using Price Action, the next step will be to wait for the appropriate setups and signals as the pair breaks below the Support and the Downtrend Line. Break below this Downtrend Line will provide added confirmation of this direction, providing the confidence required to capture that next 200-Pip trade.
付属品:
Trade Less, Earn More
Nov 19, 2014からメンバー
169 投稿
Apr 30, 2015 at 19:56
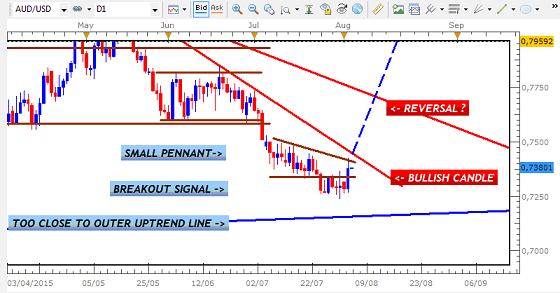
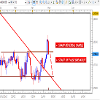
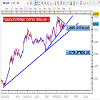
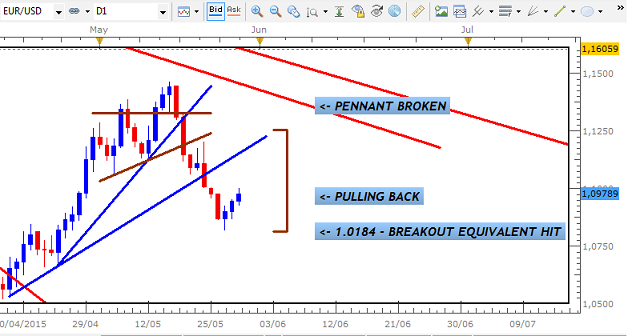
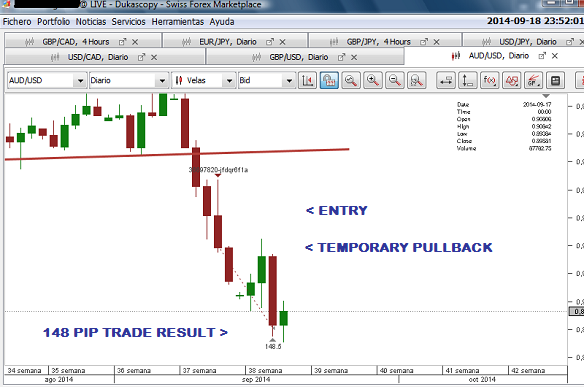
PREDICTED FALSE BREAKOUT ON AUD USD NOW STARTING?
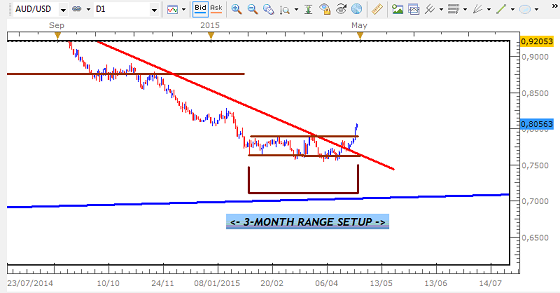
This pair had given a strong Bullish Breakout Signal above its Range Setup on the Daily Chart, indicating a possible move higher.
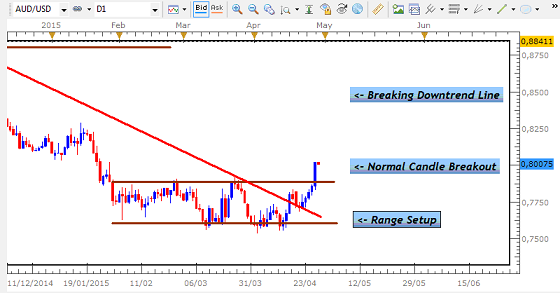
But because of the following 3 Factors, it was unlikely to go much higher.
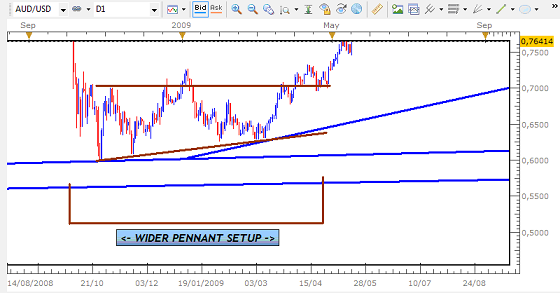
1. Pennant Consolidation had not yet reached its target - 'Breakout Equivalent'

2. We were still some distance away from the Outer Uptrend Line
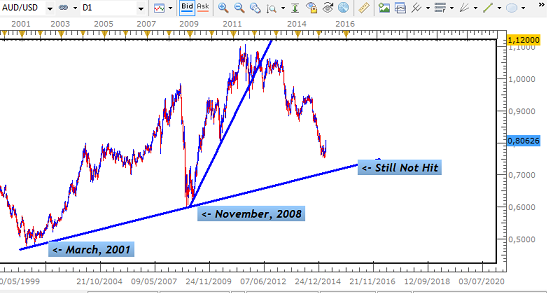
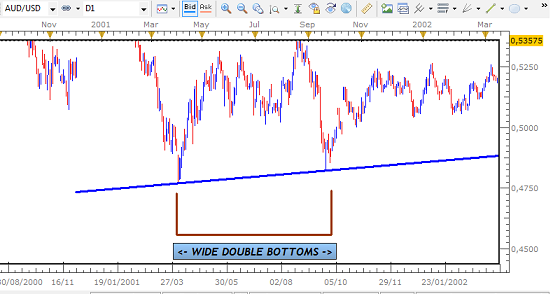
3- The Range Setup was small in comparison to the 2 Previous Support Points that formed the Outer Uptrend Line in 2001 and 2008
For these reasons, it had a very low chance of providing a profitable trade. It is therefore no surprise that since then, the pair has started to pullback sharply to take out that Bull Candle...
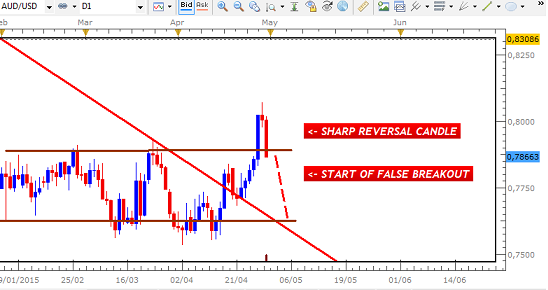
Stick with the Larger Time Frames as we can often miss key Technical Factors that will prevent an attractive Trade Setup from providing the gains we are looking for.

This pair had given a strong Bullish Breakout Signal above its Range Setup on the Daily Chart, indicating a possible move higher.
But because of the following 3 Factors, it was unlikely to go much higher.
1. Pennant Consolidation had not yet reached its target - 'Breakout Equivalent'
2. We were still some distance away from the Outer Uptrend Line
3- The Range Setup was small in comparison to the 2 Previous Support Points that formed the Outer Uptrend Line in 2001 and 2008
For these reasons, it had a very low chance of providing a profitable trade. It is therefore no surprise that since then, the pair has started to pullback sharply to take out that Bull Candle...
Stick with the Larger Time Frames as we can often miss key Technical Factors that will prevent an attractive Trade Setup from providing the gains we are looking for.
付属品:
Trade Less, Earn More

Oct 11, 2013からメンバー
775 投稿
May 04, 2015 at 04:41
Very good projections with price action analysis.
Nov 19, 2014からメンバー
169 投稿
May 13, 2015 at 06:39
Thanks Alex
Trade Less, Earn More
Nov 19, 2014からメンバー
169 投稿
May 13, 2015 at 06:39
VIDEO ANALYSIS OF GBP AUD CONSOLIDATION BREAKOUT
Has been in a strong Uptrend since 2013, forming Inner and Outer Uptrend Lines. It has now pulled back to the Inner Uptrend Line, from where it may resume the Uptrend with a Bullish Breakout signal.

In pulling to that trend line, the pair formed a Downtrend Line/Counter Trend Line and a small Range below this area. This was eventually broken on Monday May 11th with a strong Bull Candle.
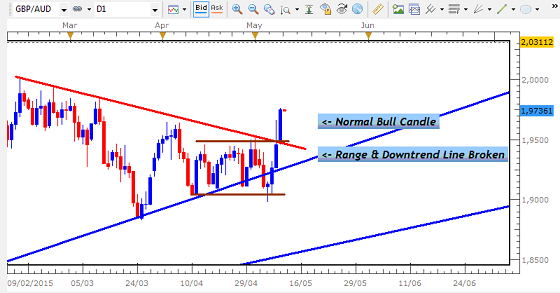
This Range that is being broken is what is known as a Normal Consolidation. This is one of the smaller Consolidations that you will see across the market on the Daily Chart. The distance between the Resistance and Support is very small and the breakout from these setups usually take a few days for their target - known as the Breakout Equivalent- to be hit.
If this breakout bullish going to continue, then we are likely to see a Bull Candle above the CTL of this 4 Hour Chart.
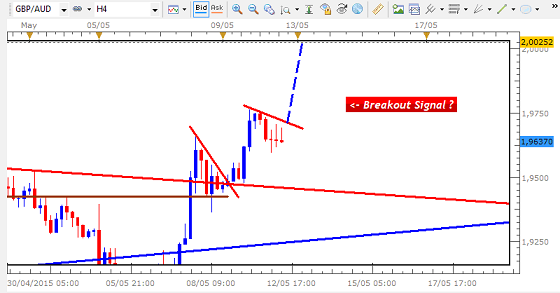
Once this takes place, the Stop Loss would be placed below the low of the CTL and the target set for 200 Pips.
Normal Consolidations are seen across all time frames, but they offer larger profits with greater stability on the Large Time Frames.
Lets see how this unfolds, hopefully we can some good Pips from this.
Duane
付属品:
Trade Less, Earn More
Nov 19, 2014からメンバー
169 投稿
May 14, 2015 at 14:13
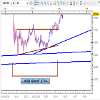
GBP JPY DAILY VIDEO ANALYSIS
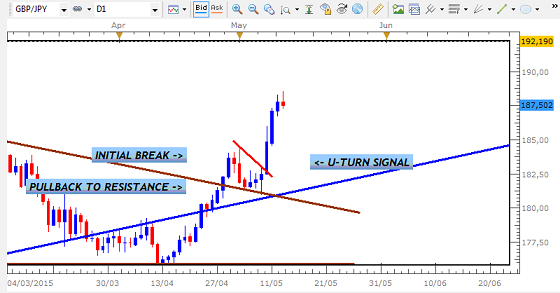
This pair has been in a very strong Uptrend that began in 2012, forming an Inner and Outer Uptrend Line and 2 Large Pennant Consolidations.
DAILY CHART - STRONG UPTREND
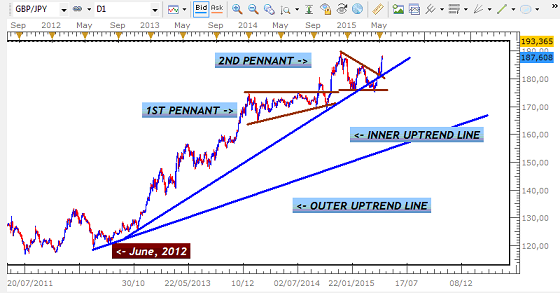
We can now see that it has started to breakout from this 2nd Pennant with strong Bullish Candles above Resistance.
DAILY CHART - CONSOLIDATION BREAKOUT

The manner in which this started is one of 3 ways in which these Consolidation setups tend to be broken in this market.
1) The First is when the market simply provides a Single Breakout Candle without any pullbacks.
2) The Second way is when the market pulls back on the inside of the barrier and then U-Turns to provide the breakout signal
3) The Third way- which is what has taken place here - is when the market initially breaks the barrier, U-Turns to test the barrier before U-Turning to give the signal that leads to the breakout.
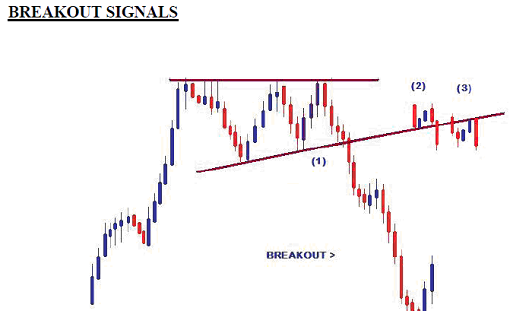
DAILY CHART - BREAKOUT SIGNAL
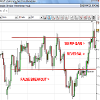
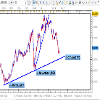
As attractive as this signal has been on the Daily Chart, the size of the Stop Losses required to trade this breakout on the 4 Hour Chart have been too large.
Based on where we would have entered at the close of the Daily Candle, the Stop Loss would have been 332 Pips for the 1st entry option. With the 2nd Bullish Signal, the Stop would have been 169 Pips- both of which are too large for the average Retail Trader.
4 HOUR CHART
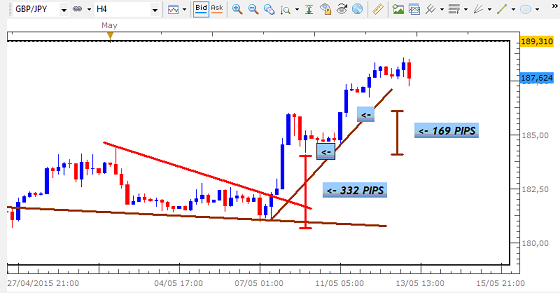
So the overall setup and breakout signal on the Daily Chart were strong, but unfortunately can’t be traded based on the Stop Losses required.
In these situations, we simply either wait on another setup on this pair that offers a smaller Stop Loss, or move on to another pair.


This pair has been in a very strong Uptrend that began in 2012, forming an Inner and Outer Uptrend Line and 2 Large Pennant Consolidations.
DAILY CHART - STRONG UPTREND
We can now see that it has started to breakout from this 2nd Pennant with strong Bullish Candles above Resistance.
DAILY CHART - CONSOLIDATION BREAKOUT
The manner in which this started is one of 3 ways in which these Consolidation setups tend to be broken in this market.
1) The First is when the market simply provides a Single Breakout Candle without any pullbacks.
2) The Second way is when the market pulls back on the inside of the barrier and then U-Turns to provide the breakout signal
3) The Third way- which is what has taken place here - is when the market initially breaks the barrier, U-Turns to test the barrier before U-Turning to give the signal that leads to the breakout.
DAILY CHART - BREAKOUT SIGNAL
As attractive as this signal has been on the Daily Chart, the size of the Stop Losses required to trade this breakout on the 4 Hour Chart have been too large.
Based on where we would have entered at the close of the Daily Candle, the Stop Loss would have been 332 Pips for the 1st entry option. With the 2nd Bullish Signal, the Stop would have been 169 Pips- both of which are too large for the average Retail Trader.
4 HOUR CHART
So the overall setup and breakout signal on the Daily Chart were strong, but unfortunately can’t be traded based on the Stop Losses required.
In these situations, we simply either wait on another setup on this pair that offers a smaller Stop Loss, or move on to another pair.
付属品:
Trade Less, Earn More
Nov 19, 2014からメンバー
169 投稿
May 17, 2015 at 06:37
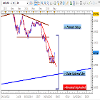
VIDEO ANALYSIS OF NZD CAD FALSE BREAKOUT
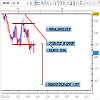
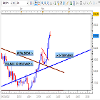
The last time we examined this pair in April this year (see above), we had projected a sharp decline in favour of the Canadian Dollar based on the False Breakout pattern that had been unfolding. In the chart below, we can see that the Bullish Candles that attempted to break out long from the Pennant were eventually taken out by the slow Bearish Candles that took us back inside of the Consolidation.
DAILY CHART - FALSE BREAKOUT

Based on this movement and the fact that False Breakouts usually lead to breaks at the opposing end of the Pennant, we had projected the pair to break towards the major Outer Uptrend Line.
DAILY CHART - PROJECTED DECLINE
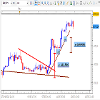
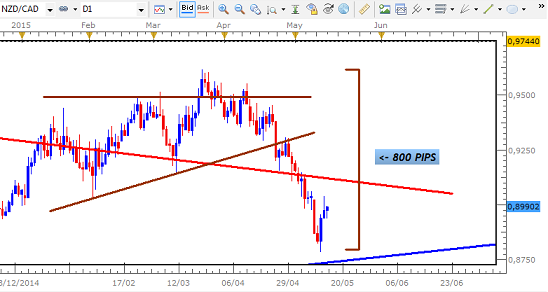
Looking at the current situation on the Daily Chart, we can see that this forecast had in fact materialized over the last few weeks. Starting from the high of the start of the reversal, the pair has declined sharply by approximately 800 Pips.
DAILY CHART - SHARP DECLINE
Now, how could you have taken advantage of this profitable move?
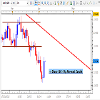
Having seen the start of the breakout below the Support of the Pennant, the first thing to do would have been to draw the Downtrend Lines that were being formed.
DAILY CHART - DOWNTREND LINES
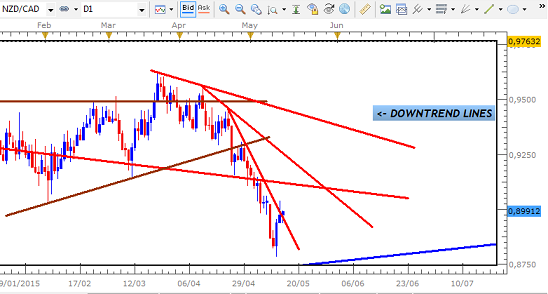
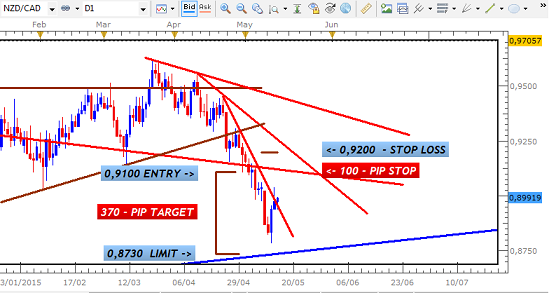
These Downtrend Lines can be used for the placement of Stop Losses with the assurance that your profits will be protected throughout the trade. The next step would have been to enter short at around the 0,9100 area, with a Stop Loss of 100 Pips placed above the Inner Downtrend Line. Your Limit Order would initially be set to the Outer Uptrend Line for a profit of 370 Pips.
DAILY CHART - ENTRY SETUP
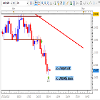
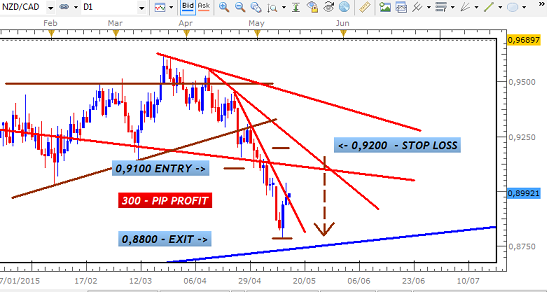
As the market began to move in you favour, you would have moved your Stop Loss lower, breaking even initially and then locking in profits below your Entry. This would have continued until the market started to reverse bullish just above the Outer Uptrend Line target. Your Stop Loss would “sadly” have been taken out and you would have pocketed 300 Pips in gains.
DAILY CHART - 300 PIP PROFIT
This is one of the ways in which Breakouts and False Breakouts can be profitably traded in this market. Many of these opportunities are likely to continue to present themselves for us given the current environment of low liquidity that now characterizes the major Currency Pairs. As Swing Traders, we simply need to spot these setups and the appropriate signals provided to take advantage of them, for continued monetary reward.
付属品:


Trade Less, Earn More
Nov 19, 2014からメンバー
169 投稿
May 19, 2015 at 06:33
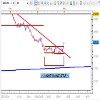
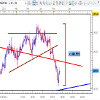
EURO USD FORMING CONSOLIDATION SETUP
The EURO USD may be in the early stages of forming a Consolidation Setup based on the nature of the sharp rally that has taken place over the last few days. If we see this play out over the course of the next few weeks, there may be an opportunity for us to trade within the boundaries of Support and Resistance until a breakout takes place.
As we can see in the chart below, the pair has finally broken the Large Pennant Consolidation that was formed between 2008 and 2014.
DAILY CHART - PENNANT BREAKOUT
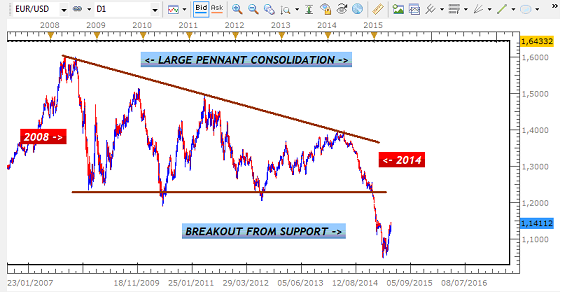
Given the size of this Consolidation, we should expect this breakout to continue in favour of the USD for the Medium to Long-Term heading into 2016. However, as we can appreciate more clearly from the chart below, the EURO has started to rally in defiance of this overall outlook.
DAILY CHART - BREAK OF INNER TREND LINE
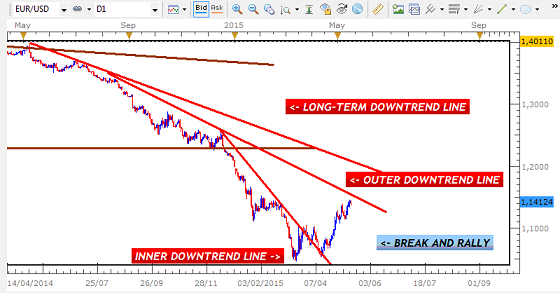
The Inner Downtrend Line was broken with a pair of Double Bottoms. This has been followed by a sharp rally that appears to be taking the pair to the Outer Downtrend Line. If that barrier is hit, the pair could continue even higher towards the Long-Term Downtrend Line before breaking back inside of the Pennant.
On the other hand, it could also U-Turn bearish to resume the overall direction of the Consolidation Breakout at either the Outer or Long-Term Downtrend Line.
DAILY CHART - FORECAST SCENARIOS
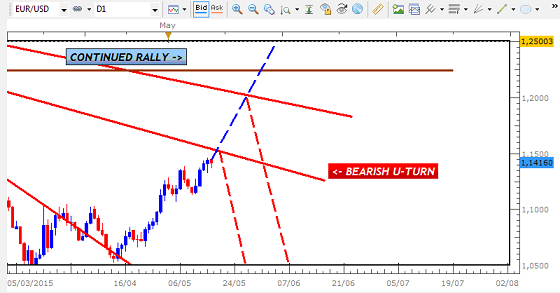
Despite the possibility of a bullish scenario that takes us back inside of the Pennant, the current strength of the Downtrend makes a bearish U-Turn the more likely outcome over the next few weeks. Another reason for this bearish outlook has to do with the nature of the candles that have led to the current rally taking place. The sharp movement, the small candles and the fact that the reversal follows a very long trend, are some of the signs of the start of a Consolidation Setup.
This means that we could see a pullback at either of those two Trend Lines to form the 1st Resistance point of a Consolidation Setup.
DAILY CHART - PROJECTED CONSOLIDATION
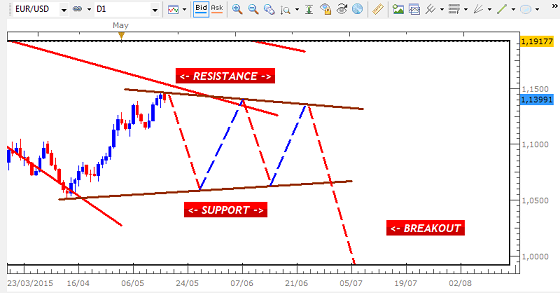
If this materializes, then we will have opportunities to trade between Support and Resistance until the breakout takes place. We will do this by firstly determining the time frame that is controlling the signals and then analyze and trade accordingly for our 100 to 200 Pip Targets.
Duane


The EURO USD may be in the early stages of forming a Consolidation Setup based on the nature of the sharp rally that has taken place over the last few days. If we see this play out over the course of the next few weeks, there may be an opportunity for us to trade within the boundaries of Support and Resistance until a breakout takes place.
As we can see in the chart below, the pair has finally broken the Large Pennant Consolidation that was formed between 2008 and 2014.
DAILY CHART - PENNANT BREAKOUT
Given the size of this Consolidation, we should expect this breakout to continue in favour of the USD for the Medium to Long-Term heading into 2016. However, as we can appreciate more clearly from the chart below, the EURO has started to rally in defiance of this overall outlook.
DAILY CHART - BREAK OF INNER TREND LINE
The Inner Downtrend Line was broken with a pair of Double Bottoms. This has been followed by a sharp rally that appears to be taking the pair to the Outer Downtrend Line. If that barrier is hit, the pair could continue even higher towards the Long-Term Downtrend Line before breaking back inside of the Pennant.
On the other hand, it could also U-Turn bearish to resume the overall direction of the Consolidation Breakout at either the Outer or Long-Term Downtrend Line.
DAILY CHART - FORECAST SCENARIOS
Despite the possibility of a bullish scenario that takes us back inside of the Pennant, the current strength of the Downtrend makes a bearish U-Turn the more likely outcome over the next few weeks. Another reason for this bearish outlook has to do with the nature of the candles that have led to the current rally taking place. The sharp movement, the small candles and the fact that the reversal follows a very long trend, are some of the signs of the start of a Consolidation Setup.
This means that we could see a pullback at either of those two Trend Lines to form the 1st Resistance point of a Consolidation Setup.
DAILY CHART - PROJECTED CONSOLIDATION
If this materializes, then we will have opportunities to trade between Support and Resistance until the breakout takes place. We will do this by firstly determining the time frame that is controlling the signals and then analyze and trade accordingly for our 100 to 200 Pip Targets.
Duane
付属品:
Trade Less, Earn More
Nov 19, 2014からメンバー
169 投稿
May 21, 2015 at 07:17
GBP USD - SETTING UP FOR FALSE BREAKOUT
This pair looks to be heading back inside of the Large Consolidation Pennant on the Daily Chart after 2 failed attempts to breakout short. Its now back at the Support area and may be getting ready to rally again after briefly pulling back to the Daily Uptrend Line.
(See Video Analysis)
Duane
This pair looks to be heading back inside of the Large Consolidation Pennant on the Daily Chart after 2 failed attempts to breakout short. Its now back at the Support area and may be getting ready to rally again after briefly pulling back to the Daily Uptrend Line.
(See Video Analysis)
Duane
Trade Less, Earn More
Nov 19, 2014からメンバー
169 投稿
May 22, 2015 at 07:16
USD JPY LIKELY TO PULLBACK LOWER DESPITE BULLISH SIGNAL
Expect a pullback bearish over the next 24 hours at least before any bullish movement continues.
We are near a Resistance of the large Pennant and something on the 4H Chart (related to a rule about when Trends end) is going to prevent the pair from breaking higher.
Trade Less, Earn More
Nov 19, 2014からメンバー
169 投稿
May 25, 2015 at 12:02
For Day Traders, 30 Minute Chart shaping as expected so far, with possible 90 Pips on offer today.
Swing Traders may have to wait on a stronger, more convincing Daily Signal to head short.
Duane
Trade Less, Earn More
Nov 19, 2014からメンバー
169 投稿
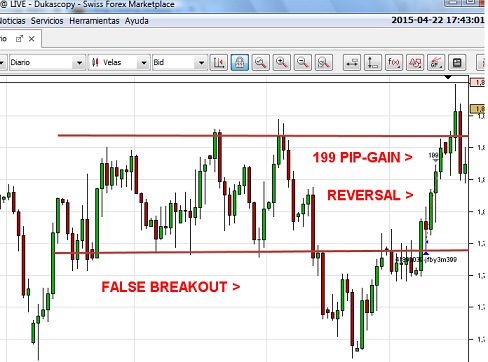
May 29, 2015 at 07:50
This False Breakout Setup and Signal that were seen a few days ago have now led to a strong Bearish reversal back inside of the Range Setup on the Daily Chart.
Some traders would have entered short after seeing the Double Tops appear above Resistance. With entry at this area and a target set for the Support, they could be now be earning close to 300 Pips from this trade. For others who waited for the break inside of the Resistance for added confirmation, they could be up between 90 to 200 Pips.
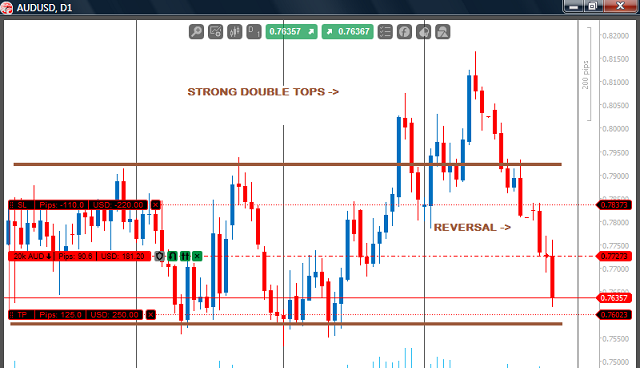
False Breakouts take place all the time with Consolidation, and the Double Tops/Bottoms are common signals that lead to these sharp moves.
Once the Support is hit, there are three possible scenarios that could unfold..
Duane
Some traders would have entered short after seeing the Double Tops appear above Resistance. With entry at this area and a target set for the Support, they could be now be earning close to 300 Pips from this trade. For others who waited for the break inside of the Resistance for added confirmation, they could be up between 90 to 200 Pips.
False Breakouts take place all the time with Consolidation, and the Double Tops/Bottoms are common signals that lead to these sharp moves.
Once the Support is hit, there are three possible scenarios that could unfold..
Duane
付属品:
Trade Less, Earn More
Nov 19, 2014からメンバー
169 投稿
May 29, 2015 at 15:46
EURO USD VIDEO ANALYSIS
The Pennant and Uptrend Lines were broken with a strong Bearish Candle, but it was also close to the Breakout Equivalent of this Pennant. This would have made short trades very risky...
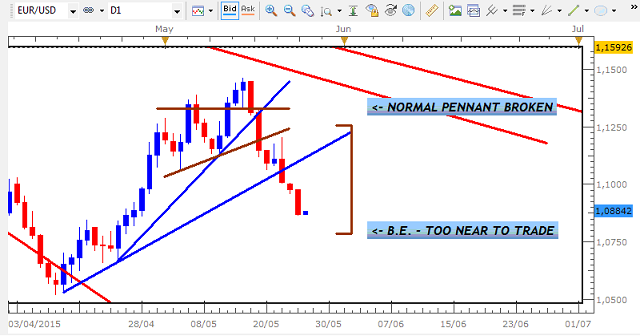
As expected, the pullback eventually started with small, but bullish candles appearing...
From here, we could either see a pullback that resumes the small Uptrend in favour of the EURO or a Bearsih signal that continues the predominant Downtrend.
The Pennant and Uptrend Lines were broken with a strong Bearish Candle, but it was also close to the Breakout Equivalent of this Pennant. This would have made short trades very risky...
As expected, the pullback eventually started with small, but bullish candles appearing...
From here, we could either see a pullback that resumes the small Uptrend in favour of the EURO or a Bearsih signal that continues the predominant Downtrend.
付属品:
Trade Less, Earn More
Oct 11, 2013からメンバー
775 投稿
Jun 02, 2015 at 03:44
The pullback is inevitable, thats why we must be patient and wait for the right moment.
Nov 19, 2014からメンバー
169 投稿
Jun 02, 2015 at 16:11
(編集済みのJun 02, 2015 at 16:14)
Yes alex, spotting these pullback areas makes a big difference with our trading.
Thats one of the benefits of the Larger Time Frames - youre able to see these major pullback points which can take you by surprise when focusing on the Smaller Charts.
Thats one of the benefits of the Larger Time Frames - youre able to see these major pullback points which can take you by surprise when focusing on the Smaller Charts.
Trade Less, Earn More
Nov 19, 2014からメンバー
169 投稿
Jun 02, 2015 at 16:15
EURO CAD VIDEO ANALYSIS
Bulls now attempting to take control of the Bull Crown setup by breaking above the Range Resistance.
First target will be the Outer Downtrend Line but from there, it could continue bullish or U-Turn bearish to resume the major Downtrend in favour of the CAD.
Bulls now attempting to take control of the Bull Crown setup by breaking above the Range Resistance.
First target will be the Outer Downtrend Line but from there, it could continue bullish or U-Turn bearish to resume the major Downtrend in favour of the CAD.
Trade Less, Earn More
Nov 19, 2014からメンバー
169 投稿
Aug 05, 2015 at 11:31
Hey everyone, been a long time, crazy few months.
Gonna get the ball rolling again with a Summary of the 35% Return I have generated from my Methodology. This includes trades made before the FXCM Accounts that you see here were opened.
JULY 1, 2014 - JULY 23, 2015
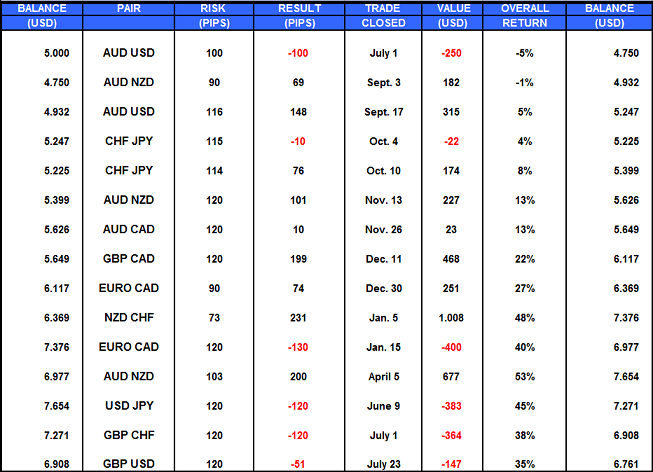
During this 13 - Month period, the Methodology targeted trades of between 100 and 200 Pips with some having to be closed below that 100- Pip Minimum. This was because they had not yet reached their targets at the end of the Holding Period. Once trades have not yet hit their targets by the end of this period they are closed regardless of their floating value. This is a way of ensuring that I do not hold out for more than the market is actually offering- the greed factor that gets in our way.
One of the challenges with these Swing Trades is the patience to wait for the trades to be closed over the Holding Period which can be as 'many' as 7 Days. Compared to Day Trading where we are almost required to constantly check our trades every minute of the day, waiting several days can seem like an eternity. Ideally, it is always better if all our trades could reach their targets within 1 or 3 days to reduce our anxiety...

...but there are times when the market does force us to be patient when trades take longer, but the wait will usually be still worth it...
The latter part of the table shows that I have entered into a little bit of bad luck with 3 losing trades. This requires an even greater level of patience to be able to regain composure and confidence to then get back to winning ways. Swing Trading has the other advantage of allowing us time in between trades to regain our objectivity without the need to rush back into the market. Since we have more time in between trades and we only need to trade a few times per year to achieve strong rates of return, getting over this hurdle can be a less challenging.
The markets seem to be in a bit of a dry spell, but once there are breakouts that are in sync with the Methodology, profitable trades are likely to be offered.
Duane
DRFXTRADING

Gonna get the ball rolling again with a Summary of the 35% Return I have generated from my Methodology. This includes trades made before the FXCM Accounts that you see here were opened.
JULY 1, 2014 - JULY 23, 2015
During this 13 - Month period, the Methodology targeted trades of between 100 and 200 Pips with some having to be closed below that 100- Pip Minimum. This was because they had not yet reached their targets at the end of the Holding Period. Once trades have not yet hit their targets by the end of this period they are closed regardless of their floating value. This is a way of ensuring that I do not hold out for more than the market is actually offering- the greed factor that gets in our way.
One of the challenges with these Swing Trades is the patience to wait for the trades to be closed over the Holding Period which can be as 'many' as 7 Days. Compared to Day Trading where we are almost required to constantly check our trades every minute of the day, waiting several days can seem like an eternity. Ideally, it is always better if all our trades could reach their targets within 1 or 3 days to reduce our anxiety...
...but there are times when the market does force us to be patient when trades take longer, but the wait will usually be still worth it...
The latter part of the table shows that I have entered into a little bit of bad luck with 3 losing trades. This requires an even greater level of patience to be able to regain composure and confidence to then get back to winning ways. Swing Trading has the other advantage of allowing us time in between trades to regain our objectivity without the need to rush back into the market. Since we have more time in between trades and we only need to trade a few times per year to achieve strong rates of return, getting over this hurdle can be a less challenging.
The markets seem to be in a bit of a dry spell, but once there are breakouts that are in sync with the Methodology, profitable trades are likely to be offered.
Duane
DRFXTRADING
付属品:
Trade Less, Earn More