


Any Volume spread analysis / Wyckoff traders?


Uczestnik z Nov 21, 2011
1718 postów
Nov 24, 2013 at 19:59
Could you explain what is it about?
Nov 25, 2013 at 13:25
Volume spread analysis and Wyckoff theories are some methods to understand how markets works. Rarely this methods are used by forex traders because theres a mith that nobody can use volume in forex, however, that is not 100% true.
Preservation of capital and home runs.

Uczestnik z Mar 29, 2012
192 postów
Nov 25, 2013 at 17:26
Do you assume that whatever volume traded on your current broker is similar to the volume of the whole market? Or using an external source like myfxbook?
A smooth sea never made a skillful sailor.
Nov 25, 2013 at 18:01
Thalantas posted:
Do you assume that whatever volume traded on your current broker is similar to the volume of the whole market? Or using an external source like myfxbook?
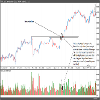
There is no traded volume in spot forex, no one can know what is the exactly amount of the lots traded in a pair at any given time. In spot forex you can use tick volume instead. Tick volume measures the changes in price. In this way, tick volume gives you the amount of activity within a time period, this activity means nothing by itself BUT when you look at what price did on that activity it can tell you ALOT of what is happening and how the relationship between supply and demand is playing out.
Now the problem becomes the data feed, this is why you should find a good, reliable, ECN broker that actually gives you reliable data feed. Find a broker that has liquidity providers and the data feed should come from several international banks.
In my humble opinion, IC Markets, Fx Pro, IBFX and maybe duckascopy are good data feed providers. Also you can use 'less retail' data feeds like eSignal (you'll have to pay monthly but it is very good data feed provider, the data is coming from 200+ banks!).
As an example of what Im talking about, I posted a chart.
Regards.
Załączniki:
Preservation of capital and home runs.
Uczestnik z Nov 21, 2011
1718 postów
Nov 25, 2013 at 18:51
Thalantas is right.
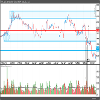
You can download MT4 from 5 differents Brokers that don't have the same liquidity providers, you will notice same volume activity on each of them. It doesn't mind the figures.
So i don't see the point to pay to get those data.
Attached same chart with same activity in volume.
You can download MT4 from 5 differents Brokers that don't have the same liquidity providers, you will notice same volume activity on each of them. It doesn't mind the figures.
So i don't see the point to pay to get those data.
Attached same chart with same activity in volume.
Załączniki:
Nov 25, 2013 at 20:59
CrazyTrader posted:
Thalantas is right.
You can download MT4 from 5 differents Brokers that don't have the same liquidity providers, you will notice same volume activity on each of them. It doesn't mind the figures.
So i don't see the point to pay to get those data.
Attached same chart with same activity in volume.
Yes, when I started to use this methods in the spot currencies market I did that, I used like a kind of filter, you see, sometimes one broker will show a volume spike and other broker don't, then you filter looking thru different brokers as you said and see what the majority of them are showing, its good to start using volume in that way, another way would be looking at the futures volume of the currency that you are analyzing (in futures you have real exchange traded volume).
Any of those mentioned methods are nice and good, it just depends of you. I prefer to pay monthly for the eSignal data feed but its not a 'required' thing to do.
Preservation of capital and home runs.
Nov 25, 2013 at 21:05
Dukascopy has really good feed.
@Rubn Interesting pattern you mention with the volumes, did you try it on a larger scale? like 1,000 occurrences or something ?
Most other brokers have the same liquidity providers tho, they go through currenex and thus can claim they have '17 banks' behind them.
@Rubn Interesting pattern you mention with the volumes, did you try it on a larger scale? like 1,000 occurrences or something ?
Most other brokers have the same liquidity providers tho, they go through currenex and thus can claim they have '17 banks' behind them.
I work in a hedge fund.
Nov 25, 2013 at 21:12
felotus posted:
Dukascopy has really good feed.
@Rubn Interesting pattern you mention with the volumes, did you try it on a larger scale? like 1,000 occurrences or something ?
Most other brokers have the same liquidity providers tho, they go through currenex and thus can claim they have '17 banks' behind them.
Hi man!
What do you mean by try it on a larger scale? 1,000 occurrences or what?
Yes! Currenex is used by alot of brokers, I don't like the viking platform very much though.
About the pattern with the volumes, do you mean like the break and test pattern that I showed on the chart? or are you talking about the correlationship between different brokers volume?
Regards.
Preservation of capital and home runs.
Nov 25, 2013 at 22:05
felotus posted:
The break + decrease of volume.
If you look at the pattern everytime you see a breakout, a retest and a decrease of volume, do you see it consistently break out further?
Oh no man, I wish it was that easy. The truth is this principles work but as we all know every move in the market its different, it depends a lot on the context (what has happened a few bars before, how powerful is the zone we are trying to break, etc).
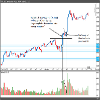
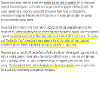
For example in this chart from november 13 we saw a break with volume, test on decreasing volume BUT then a shake out bar happened with big volume. The smart money (i.e. big hedge funds, banks, institutions) drove the price back down to the lower of the level to catch stop losses from the retail traders buying the break out (stop losses of those buy orders are triggered causing sell orders), this also caused a lot of retail traders to sell thinking that the break was fake, but look at the close of that bar marked as 'shake out', turns out smart money was BUYING from all those retail traders selling, smart money was accumulating more and more and then they marke the price up a little after that shake out.
Załączniki:
Preservation of capital and home runs.
Nov 25, 2013 at 22:10
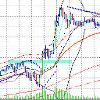
Here is another example,
A is the push thru the demand zone with high volume, the next bars are on decreasing volume (test)
B is what in VSA is called 'no demand bar' with very little volume.
Once the lower of that no demand bar is broken is a 'safe' sell.
A is the push thru the demand zone with high volume, the next bars are on decreasing volume (test)
B is what in VSA is called 'no demand bar' with very little volume.
Once the lower of that no demand bar is broken is a 'safe' sell.
Załączniki:
Preservation of capital and home runs.
Nov 25, 2013 at 22:13
Volume spread analysis and the Wyckoff method teaches you how the markets really work. And they work based on this 3 laws:
1.- Law of supply and demand
2.- Law of effort vs results
3.- Law of cause and effect
1.- Law of supply and demand
2.- Law of effort vs results
3.- Law of cause and effect
Preservation of capital and home runs.
Nov 25, 2013 at 22:15
The first chart you showed me was a 5min chart, both of these are 1 hours, don't you think it's a fundamental difference ?
The 1 hr charts -to me- represent an overall trend in the market, so I would follow the trend regardless of the volume, whereas analyzing the 5 min one sounded more like a price action analysis, a true supply/demand analysis.
The 1 hr charts -to me- represent an overall trend in the market, so I would follow the trend regardless of the volume, whereas analyzing the 5 min one sounded more like a price action analysis, a true supply/demand analysis.
I work in a hedge fund.
Nov 25, 2013 at 22:44
felotus posted:
The first chart you showed me was a 5min chart, both of these are 1 hours, don't you think it's a fundamental difference ?
Oh man, im going to get so much fundamental traders hating me on this one but IN MY HUMBLE OPINION fundamental/ news based trading is almost everytime incorrect, the newspapers tell you 'why' a sudden move just happened, truth is markets work based on supply and demand, nothing else much.
Also, retail traders have a lag in the news, we can't get the real news when its happening. The bloomberg and reuters terminals (professional platforms) have a news feed for professional traders and the news they read doesnt get out to the general public but several weeks later. This is the sad true for us retail traders. take a look at this (he is talking about the thomson reuters retail terminal), it is a review of the platform in general but he is confirming what I just said:
'Overall, where the system really excels is with its news and research abilities. For serious traders that want up to second headlines of what is occurring in the market and breaking news, this platform offers a similar look to what the professionals are using. (Example: I saw the headlines for Disney buying the Star Wars franchise on the platform before seeing headlines on mainstream news sources. For equity traders, filtering for halted stocks and those poised to gap on the open is easily done )'
Complete article here: https://forexmagnates.com/review-of-thomson-reuters-new-eikon-platform-for-retail-traders/
Anyway, manipulation is going on everyday in everytimeframe, doesn't matter if is 5min charts, 1 hour chart, daily charts, etc. The principles are the same and here is why:
If you are a big money player (im talking billions) you can't trade the way we as retail traders do. You can't just put a one-big-buy order and wait for the develompent of the trade because you will put the price UP in your buying. For instance, when retail traders want to buy they put a 1 or 10 (or maybe a little more) lots order in the market, the order its executed almost in miliseconds and the price doesnt move on your order. But imagine that you want to put a billion-worth buy order, your order will be executed accordenly to the liquidity in the moment, chances are that a little part of your order will be executed at price $1 then the price will move up to find new sellers for your order, in price $2 another part of your order gets executed and price then goes up to price $3 to find again more sellers for you to buy. In this way you (as a big money player) are buying every second a little higher (putting the price up on your buying) this is bad for you because 1.- you are not buying as cheap as you would like to buy, and 2.- chances are other professional traders are seeing the big volume spike you are generating and will know exactly what you are doing.
Preservation of capital and home runs.
Nov 25, 2013 at 22:45
felotus posted:
The 1 hr charts -to me- represent an overall trend in the market, so I would follow the trend regardless of the volume, whereas analyzing the 5 min one sounded more like a price action analysis, a true supply/demand analysis.
Yes, the trend is good. I do the same thing, the chart just was meant to show an isolated example of the pattern, sorry for the confusion.
Preservation of capital and home runs.
Nov 25, 2013 at 22:50
Rubn posted:
Anyway, manipulation is going on everyday in everytimeframe, doesn't matter if is 5min charts, 1 hour chart, daily charts, etc. The principles are the same and here is why:
If you are a big money player (im talking billions) you can't trade the way we as retail traders do. You can't just put a one-big-buy order and wait for the develompent of the trade because you will put the price UP in your buying. For instance, when retail traders want to buy they put a 1 or 10 (or maybe a little more) lots order in the market, the order its executed almost in miliseconds and the price doesnt move on your order. But imagine that you want to put a billion-worth buy order, your order will be executed accordenly to the liquidity in the moment, chances are that a little part of your order will be executed at price $1 then the price will move up to find new sellers for your order, in price $2 another part of your order gets executed and price then goes up to price $3 to find again more sellers for you to buy. In this way you (as a big money player) are buying every second a little higher (putting the price up on your buying) this is bad for you because 1.- you are not buying as cheap as you would like to buy, and 2.- chances are other professional traders are seeing the big volume spike you are generating and will know exactly what you are doing.
This is why, big money players 'accumulate' buy orders, the accumulation phase takes time but it is worth the wait because if you accumulate buy orders carefully you will not pu the price up on your buying.
Preservation of capital and home runs.
Nov 26, 2013 at 05:26
Take a look at this:
https://forexmagnates.com/major-banks-face-another-class-action-lawsuit-alleging-fx-rates-manipulation/
Richard Wyckoff talked 100 years ago about groups of big money traders working together to manipulate the markets, they were called 'trading syndicates'. Now, 100 years later, those 'syndicates' use the chat in the bloomberg's PROFESSIONAL platform to accumulate and distribute, manipulating together the prices of ALL financial markets. Please, read the article, I was mind-blowed at reading this, I knew it has happened, its happening today and will still happen in the future but this article (as many others) just confirm what I belive.
Can someone still tell me that 'forex is too big to manipulate'?
Cheers.
Załączniki:
Preservation of capital and home runs.
Nov 26, 2013 at 05:30
Volume is the only way to detect when a market its being manipulated, they can see where your stop loss is, where are all the buy orders and all the sell orders, they have the news data weeks before any of us (retail traders). But they cannot hide their positions, volume gives them away.
Regards.
Regards.
Preservation of capital and home runs.


