Will Solana’s Key Support Hold or Will Selling Resume?

Ultima Markets presents a detailed analysis of SOLUSD, offering key insights for November 12, 2025.
Is SOL's Daily Chart Pointing to a Deeper Slide?

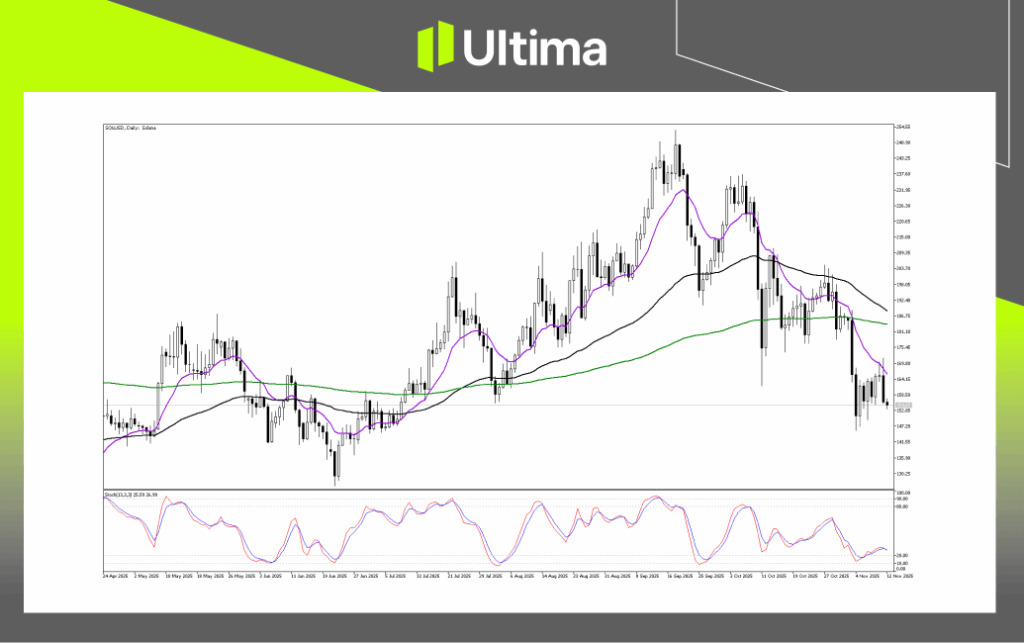
SOLUSD’s daily chart skews bearish, with the trend turning decisively from bullish to bearish and sellers firmly in control.
Key levels: Immediate support sits near $147–$150 (recent swing low). A clean break below this zone would likely extend the downswing. If that floor gives way, the next downside objective is around $130, aligning with early-August lows.
Is SOLUSD About to Break Lower or Stage a Brief Bounce?

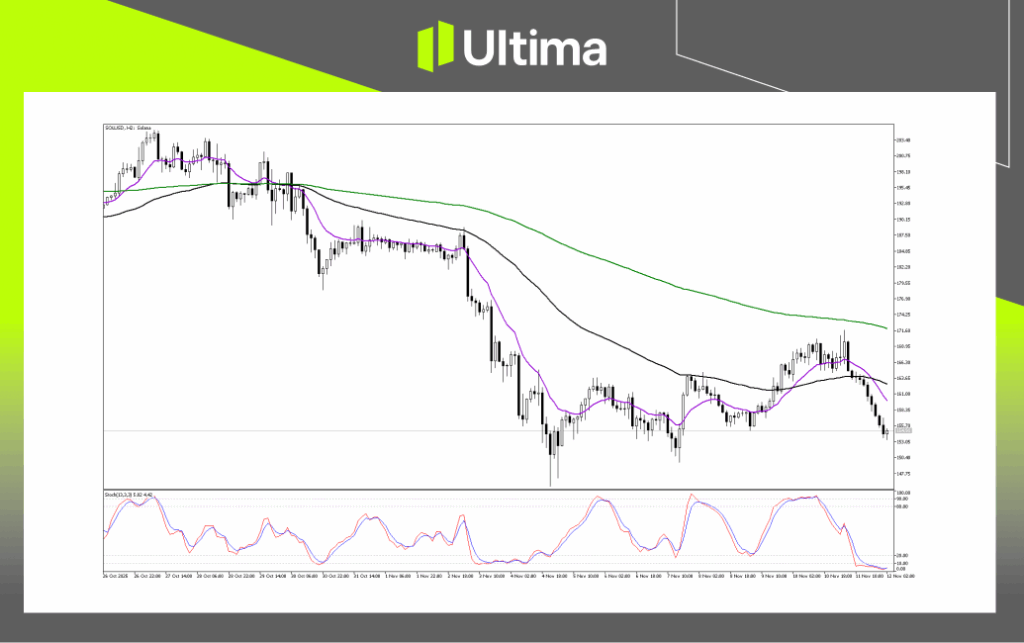
The Stochastic Oscillator has dropped into extreme oversold territory below 20, signalling heavy selling pressure. While oversold conditions can precede a bounce, in a strong trend they more often validate the prevailing downside momentum.
Primary path: bearish continuation. With momentum dominant, the higher-probability outcome is a breakdown that extends the decline toward support at $150.40 (S1), then the critical low at $147.75 (S2). A two-hour close decisively beneath $147.75 would confirm the breach and open scope for a deeper slide.
Alternate path: brief bounce or retest. Given the oversold reading, a short rebound toward the nearby resistance band at $161.00 to $163.00 (R1) is possible. Bearish rejection signals in this zone would offer a high-probability opportunity for sellers to rejoin the trend.
Low-probability path: bullish reversal. For any bullish case to gain traction, the price would first need to reclaim the R1 area. A meaningful shift in the short-term trend would require a sustained break and close above the stronger resistance at $171.60 (R2), which would invalidate the current lower-high structure.
Is This Just a Pause Before the Next Leg Down?

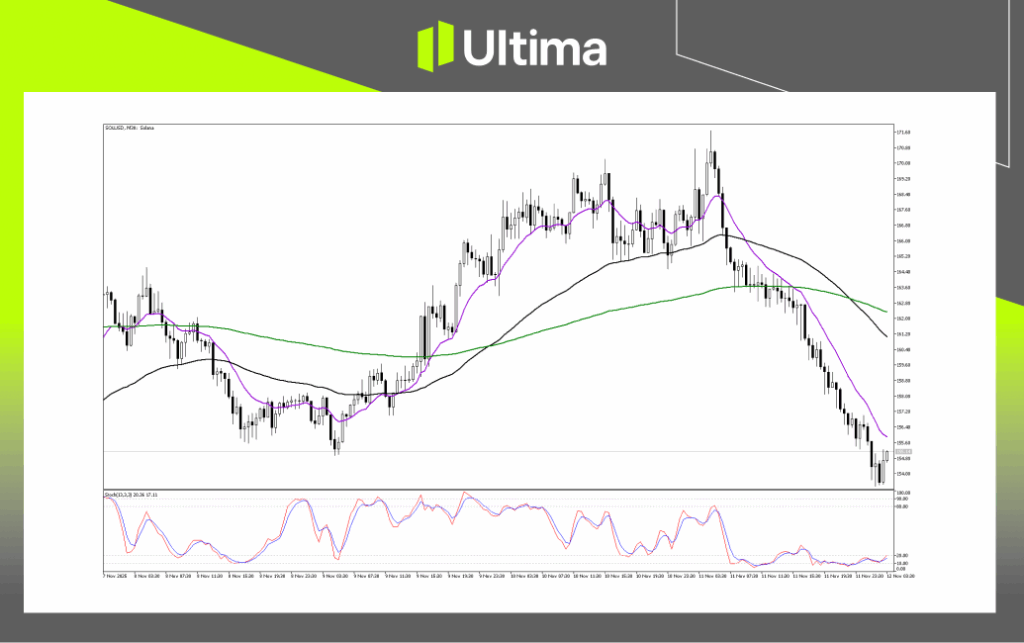
The chart shows a waterfall-style slide from the recent peak above $171, with consecutive long bearish candles and only shallow pauses. This is evidence of aggressive selling and firm downside momentum. After printing a new local low, price is trying to carve out a short-term base.
The higher-probability path is continued downside after a brief pause or modest bounce. A decisive break and close beneath the nearby support around $153 would likely extend the downtrend toward the next psychological and technical floors on higher time frames, roughly in the $150 area.
A second, moderate-probability outcome is brief consolidation or a mild relief rally, given the oversold backdrop. Any uptick would likely stall near the immediate resistance band around $157–$158, forming a bear-flag type structure that often precedes another leg lower.
A stronger corrective rebound is less likely without a clear catalyst. In that case, price could probe the heavier resistance zone near $162–$163.60, which many traders would view as a preferred area to re-establish short exposure on signs of rejection. Only a sustained move above that zone would begin to neutralise the immediate bearish pressure.
Navigating the Forex Market with Ultima Markets
Stay informed and make data-driven decisions. For structured learning, visit UM Academy for concise lessons on strategy, risk management, and real-world setups across digital assets and other markets. Learn at your own pace and strengthen your market knowledge.
—–
Legal Documents
Trading leveraged derivative products carries a high level of risk and may not be suitable for all investors. Leverage can magnify both gains and losses, potentially resulting in rapid and substantial capital loss. Before trading, carefully assess your investment objectives, level of experience, and risk tolerance. If you are uncertain, seek advice from a licensed financial adviser. Leveraged products are not intended for inexperienced investors who do not fully understand the risks or who are unable to bear the possibility of significant losses.
Copyright © 2025 Ultima Markets Ltd. All rights reserved.
Disclaimer
Comments, news, research, analysis, price, and all information contained in the article only serve as general information for readers and do not suggest any advice. Ultima Markets has taken reasonable measures to provide up-to-date information, but cannot guarantee accuracy, and may modify without notice. Ultima Markets will not be responsible for any loss incurred due to the application of the information provided.


