


Why same company stock charts(price curves) looks different?
Sep 16, 2019 at 10:15
420 Angesehen
3 Replies
Sep 16, 2019 at 10:15
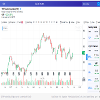
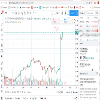
Does anyone know why stock charts looks different depending on the broker you use? I mean; same company two totally different charts(price curves). I added two charts here, hopefully they're visible. Both pictures are weekly charts and company is TCF FINANCIAL CORP. They look totally different in cmc markets compared to chart on finance.yahoo.com
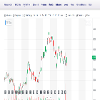
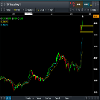
Anhänge:
Mitglied seit Sep 16, 2019
11 Posts
Sep 16, 2019 at 10:48
You sure they are the same company? The prices are different too

*Kommerzielle Nutzung und Spam werden nicht toleriert und können zur Kündigung des Kontos führen.
Tipp: Wenn Sie ein Bild/eine Youtube-Url posten, wird diese automatisch in Ihren Beitrag eingebettet!
Tipp: Tippen Sie das @-Zeichen ein, um einen an dieser Diskussion teilnehmenden Benutzernamen automatisch zu vervollständigen.


