Edit Your Comment
gold advise
Jul 10, 2014からメンバー
1117 投稿
Oct 11, 2013からメンバー
775 投稿
Nov 16, 2018 at 02:15
Oct 11, 2013からメンバー
775 投稿
Gold has found a good resistance at the 55 day EMA around the 1216 level and if the price bounces to the downside, it may consolidate between the 1200 level and the 55 day EMA. The most relevant support levels are the 1180 level and the low at the 1160 level. Above the 55 day EMA, the 200 day EMA is still its most relevant resistance at the 1245 level.
Jul 10, 2014からメンバー
1117 投稿
Jul 10, 2014からメンバー
1117 投稿
Oct 11, 2013からメンバー
775 投稿
Nov 20, 2018 at 00:18
Oct 11, 2013からメンバー
775 投稿
Gold breaks above the 55 day EMA at the 1216 level and reaches the 1223 zone. To the upside, we must be aware of the 200 day EMA around the 1244 level, because it could act as resistance. Below the 55 day EMA, its next support is still the 1200 level.
Jul 10, 2014からメンバー
1117 投稿
Jul 10, 2014からメンバー
1117 投稿
Jul 10, 2014からメンバー
1117 投稿
Jul 10, 2014からメンバー
1117 投稿
Jul 10, 2014からメンバー
1117 投稿
Oct 11, 2013からメンバー
775 投稿
Jul 10, 2014からメンバー
1117 投稿
Oct 11, 2013からメンバー
775 投稿
Dec 04, 2018 at 20:43
Oct 11, 2013からメンバー
775 投稿
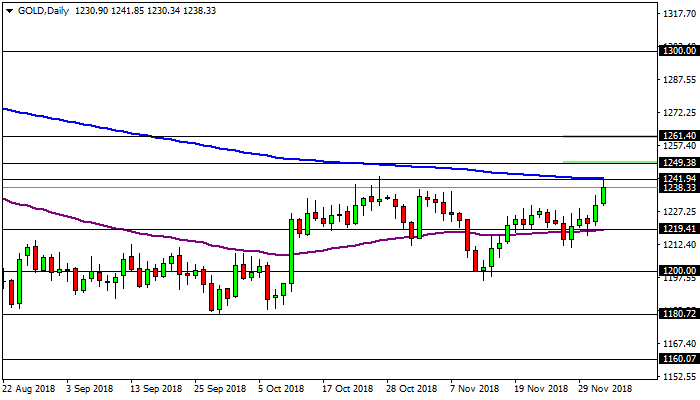
Possible obstacles on gold’s rally. Gold accelerates its bullish momentum during today’s session and reaches the 1241 level, zone that is has not visited since October 26th. Gold has been supported by the pullback on the Dollar, but if the greenback goes back to its bullish trend, then gold may try to fall back down. Even if the price of gold manages to break above the 200 day EMA at the 1241 level, its next resistances are at the 1249 level where we can find the 55 week EMA and the 1261 level where we can find the 200 week EMA. In case of a breakout above the 200 week EMA at the 1261 level, gold could have the road clear for a rally to the 1300 level. On the other hand, if gold pulls back down, then the 55 day EMA at the 1219 level could act as support, followed by the 1200 psychological level.


Oct 11, 2013からメンバー
775 投稿
Oct 11, 2013からメンバー
775 投稿
Oct 11, 2013からメンバー
775 投稿
Dec 19, 2018 at 18:01
Oct 11, 2013からメンバー
775 投稿
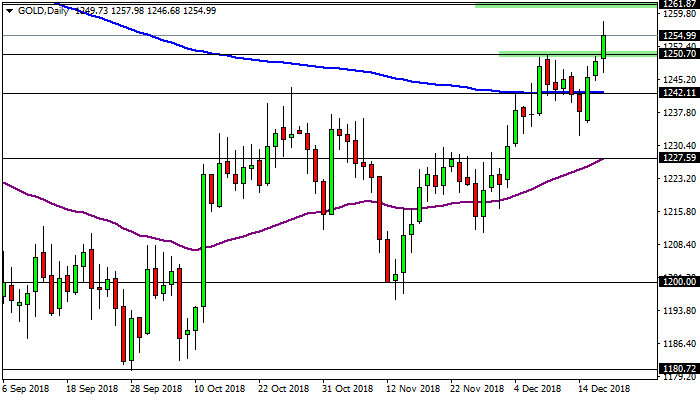
Bullish breakout on gold. The price of gold breaks above the 55 week EMA at the 1250 level and settles around the 1254 level. Gold is supported by the drop on the US Dollar and if it continues higher, the 200 week EMA at the 1261 level could act as resistance. In case of a pullback, the 200 day EMA at the 1242 level could act as support. Below the 200 day EMA, its next support could be the 55 day EMA at the 1227 level.


Oct 11, 2013からメンバー
775 投稿
Dec 20, 2018 at 20:05
Oct 11, 2013からメンバー
775 投稿
Gold breaks above the 1261 level where we can find the 200 week EMA, but it could find some resistance around that zone. In case of a pullback, the 55 week EMA at the 1250 level could act as support, followed by the 200 day EMA at the 1242 level.
Oct 11, 2013からメンバー
775 投稿
Jan 04, 2019 at 00:47
Oct 11, 2013からメンバー
775 投稿
Dostiev posted:
Is gold anti correlated to stocks? Gold has increased as S&P has fallen. Is this what they call a flight to safety?
Yes. Gold and stocks usually have a negative correlation, because gold acts as a safe haven asset during uncertainty in stocks.

*商用利用やスパムは容認されていないので、アカウントが停止される可能性があります。
ヒント:画像/YouTubeのURLを投稿すると自動的に埋め込まれます!
ヒント:この討論に参加しているユーザー名をオートコンプリートするには、@記号を入力します。


