


British Pound, GBP/USD, GBP/JPY, Symmetrical Triangle, IGCS – Talking Points:
- The British Pound’s recent weakness against its haven-associated counterparts may prove to be short-lived.
- GBP/USD poised to extend gains as prices consolidate above key support.
- 8-EMA guiding GBP/JPY rates higher.

The British Pound has drifted lower over the last couple of weeks against the haven-associated Japanese Yen and US Dollar. However, longer-term technical setups suggest that this period of weakness may prove short-lived. Here are the key levels to watch for GBP/USD and GBP/JPY rates.
GBP/USD Weekly Chart – Consolidating Above 50% Fibonacci Expansion
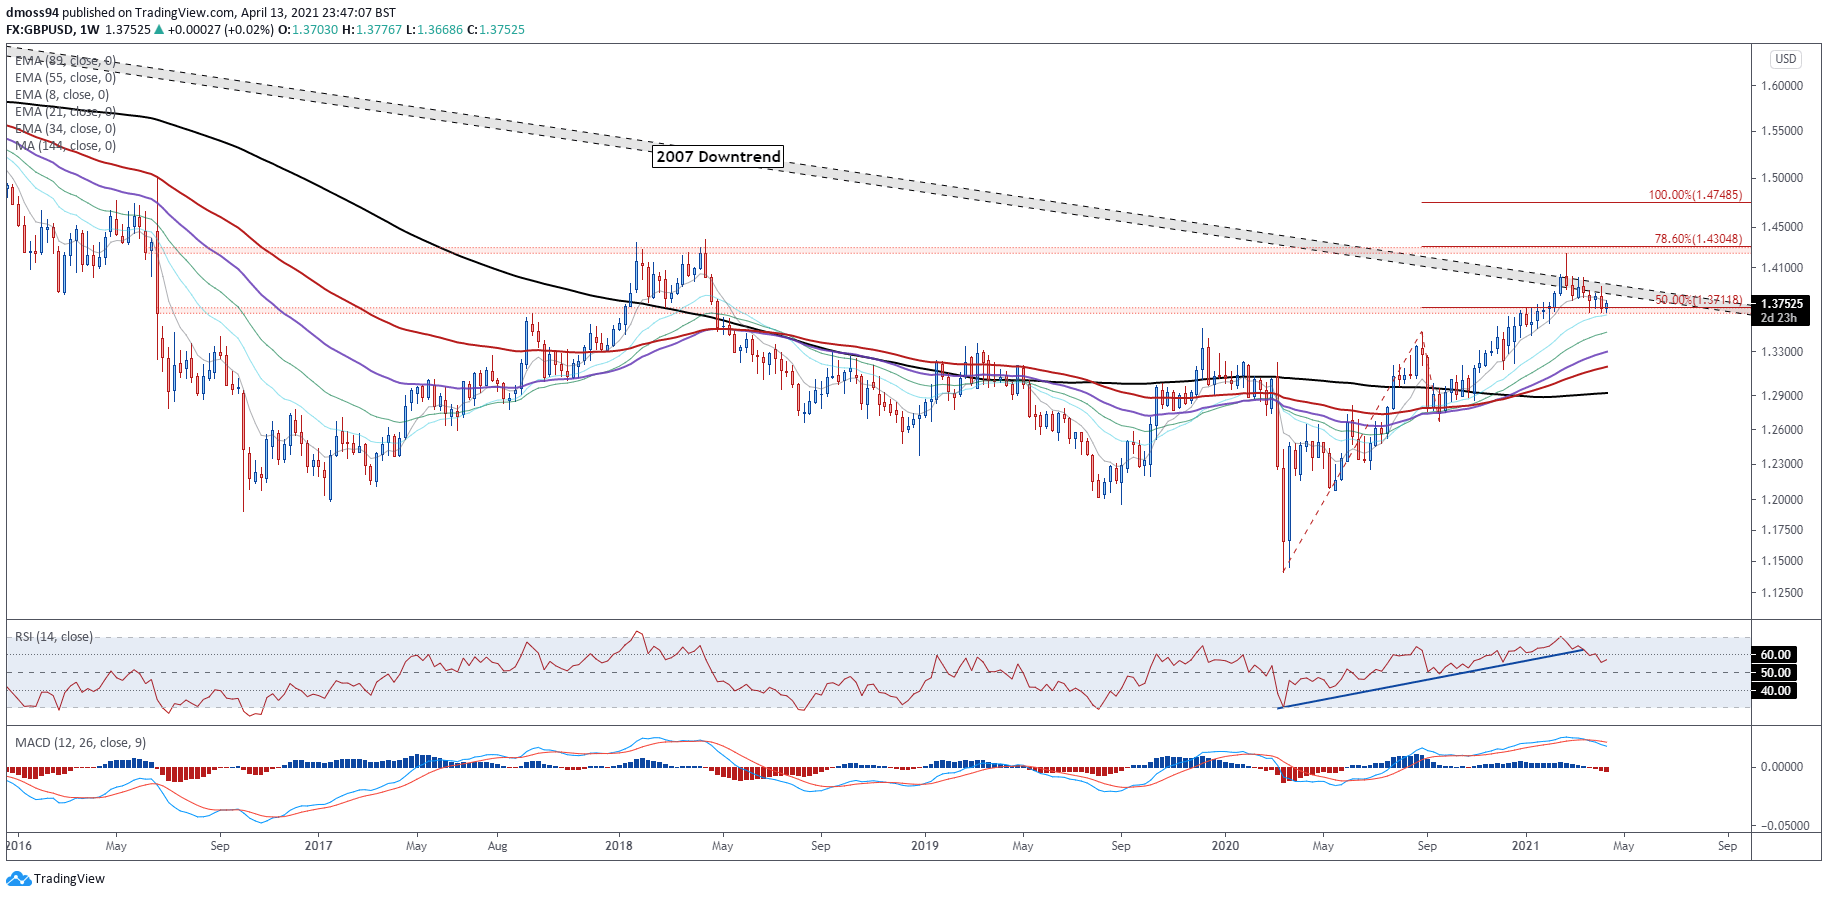
Chart prepared by Daniel Moss, created with Tradingview
The longer-term outlook for GBP/USD continues to favour further gains, as prices consolidate above key confluent support at the 50% Fibonacci (1.3712) and 21-week EMA. Although both the RSI and MACD have faded notably from their respective highs, this has failed to garner any significant bearish follow-through in price action.
With that in mind, staying constructively positioned above 1.3700 probably paves the way for GBP/USD to continue gaining ground in the coming weeks, with a close above the April high (1.3918) needed to validate the break of the 2007 downtrend.
However, plunging below the 21-EMA (1.3645) could intensify selling pressure and propel price back to support at the January low (1.3451). Hurdling that may bring the trend-defining 55-EMA (1.3301) into play.
GBP/USD Daily Chart – Schiff Pitchfork Guiding Price Higher
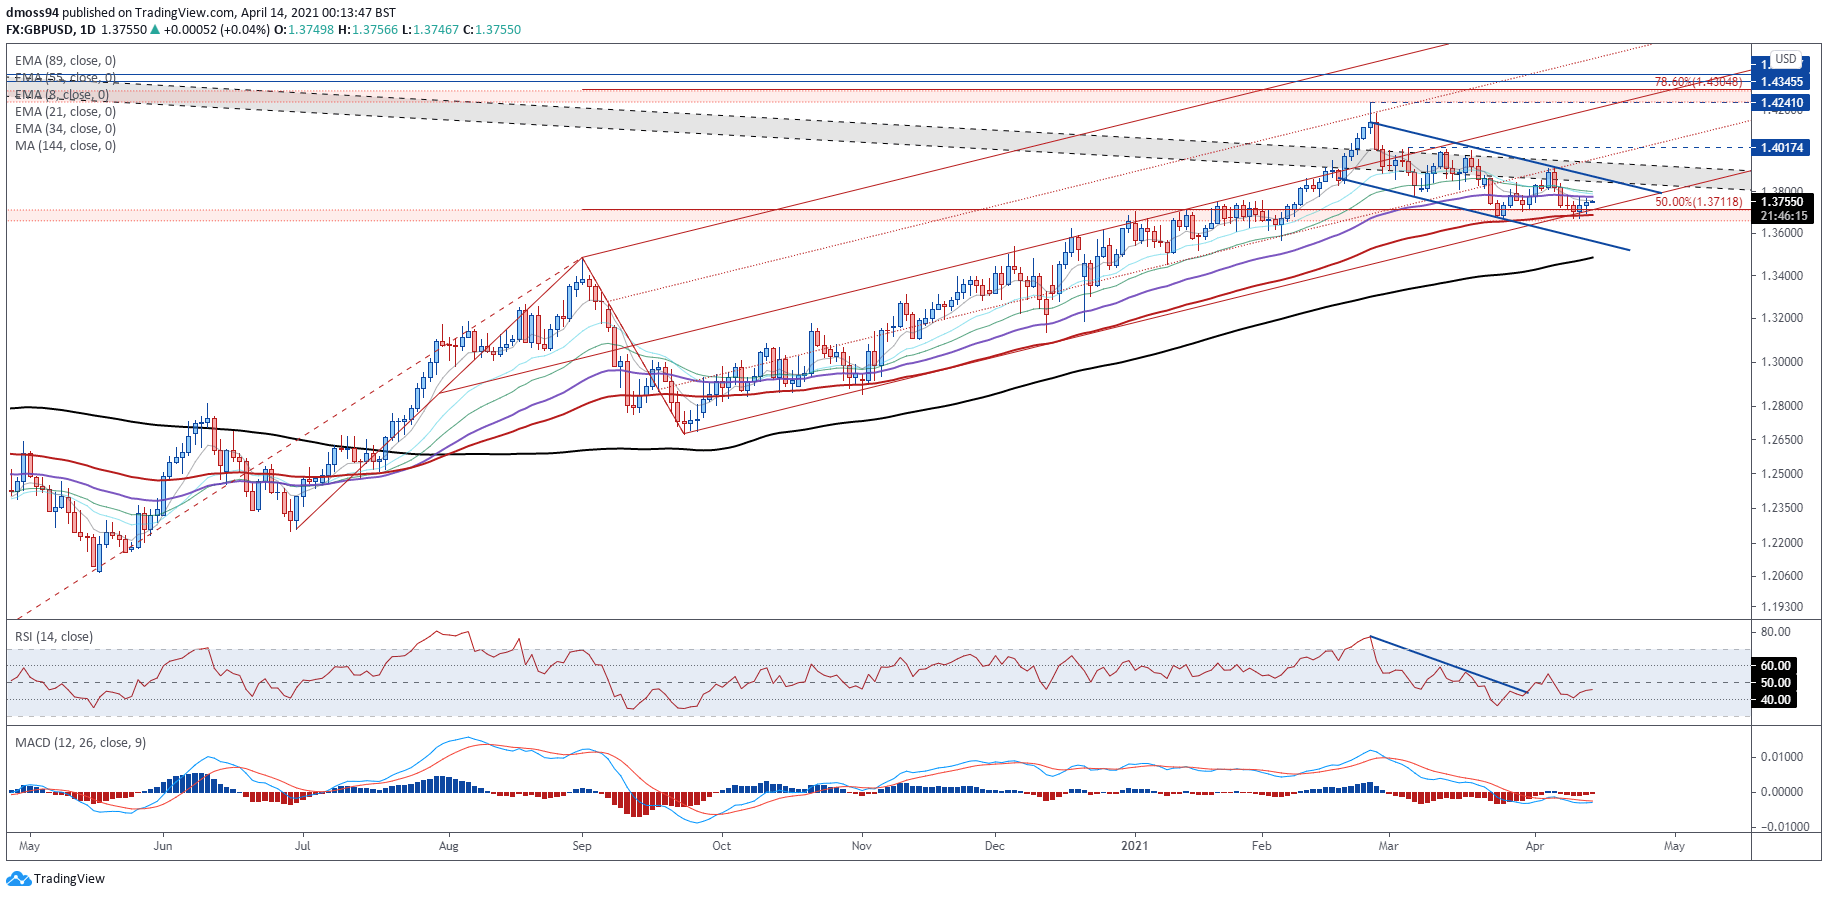
Chart prepared by Daniel Moss, created with Tradingview
The daily chart reinforces the bullish outlook depicted on the weekly chart, as the exchange rate tracks within the confines of an ascending Schiff Pitchfork and hovers above the 89-EMA (1.3688).
A daily close back above the 55-EMA (1.3775) paves the way for a retest of the April high (1.3919). Clearing that likely triggers an impulsive push to challenge the yearly high (1.4241).
Alternatively, piercing the pitchfork parallel and 1.3700 handle could precipitate a more extended pullback towards the February low (1.3566).
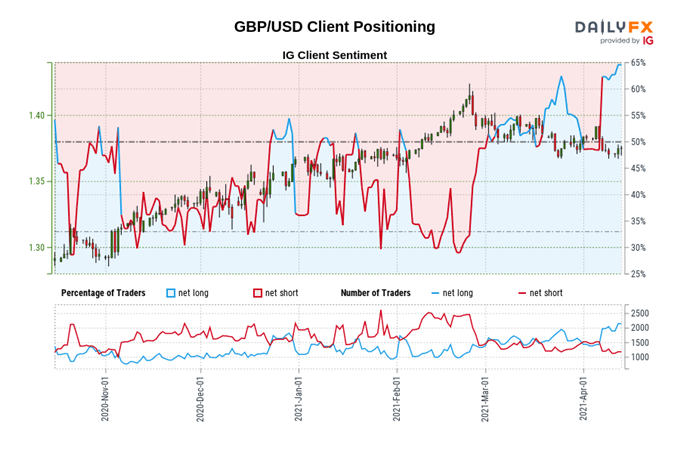
The IG Client Sentiment Report shows 63.07% of traders are net-long with the ratio of traders long to short at 1.71 to 1. The number of traders net-long is 3.37% lower than yesterday and 11.21% higher from last week, while the number of traders net-short is 3.48% lower than yesterday and 11.12% lower from last week.
We typically take a contrarian view to crowd sentiment, and the fact traders are net-long suggests GBP/USD prices may continue to fall.
Traders are further net-long than yesterday and last week, and the combination of current sentiment and recent changes gives us a stronger GBP/USD-bearish contrarian trading bias.
GBP/JPY Weekly Chart – Constructively Positioned Above Psychological Support
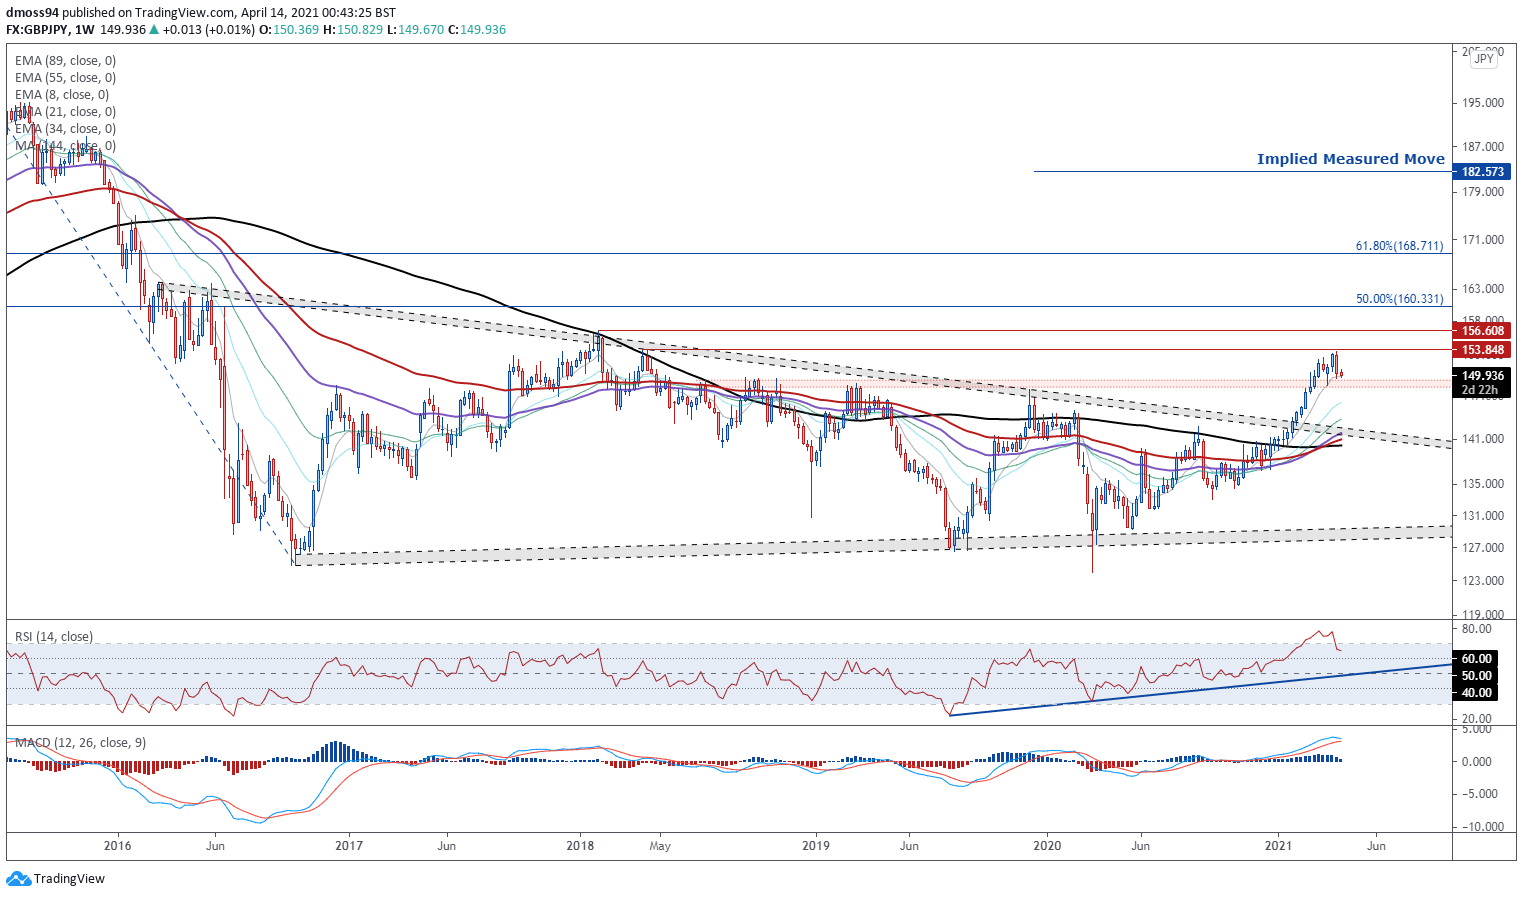
Chart prepared by Daniel Moss, created with Tradingview
The longer-term outlook for GBP/JPY rates also appears overtly bullish, given prices have broken out of a 4-year Symmetrical Triangle pattern and are consolidating above key psychological support at 149.00.
Indeed, with the MACD and RSI tracking firmly above their respective neutral midpoints, the path of least resistance seems skewed to the topside.
If 149.00 holds firm, a continued push higher seems more than likely, with a weekly close above the yearly high (153.41) required to signal the resumption of the primary uptrend and bring the 2018 high (156.61) into focus.
That being said, a weekly close below 148.30 could trigger a short-term pullback to the 21-EMA (146.10).
GBP/JPY Daily Chart – Ascending Channel Support Under Pressure
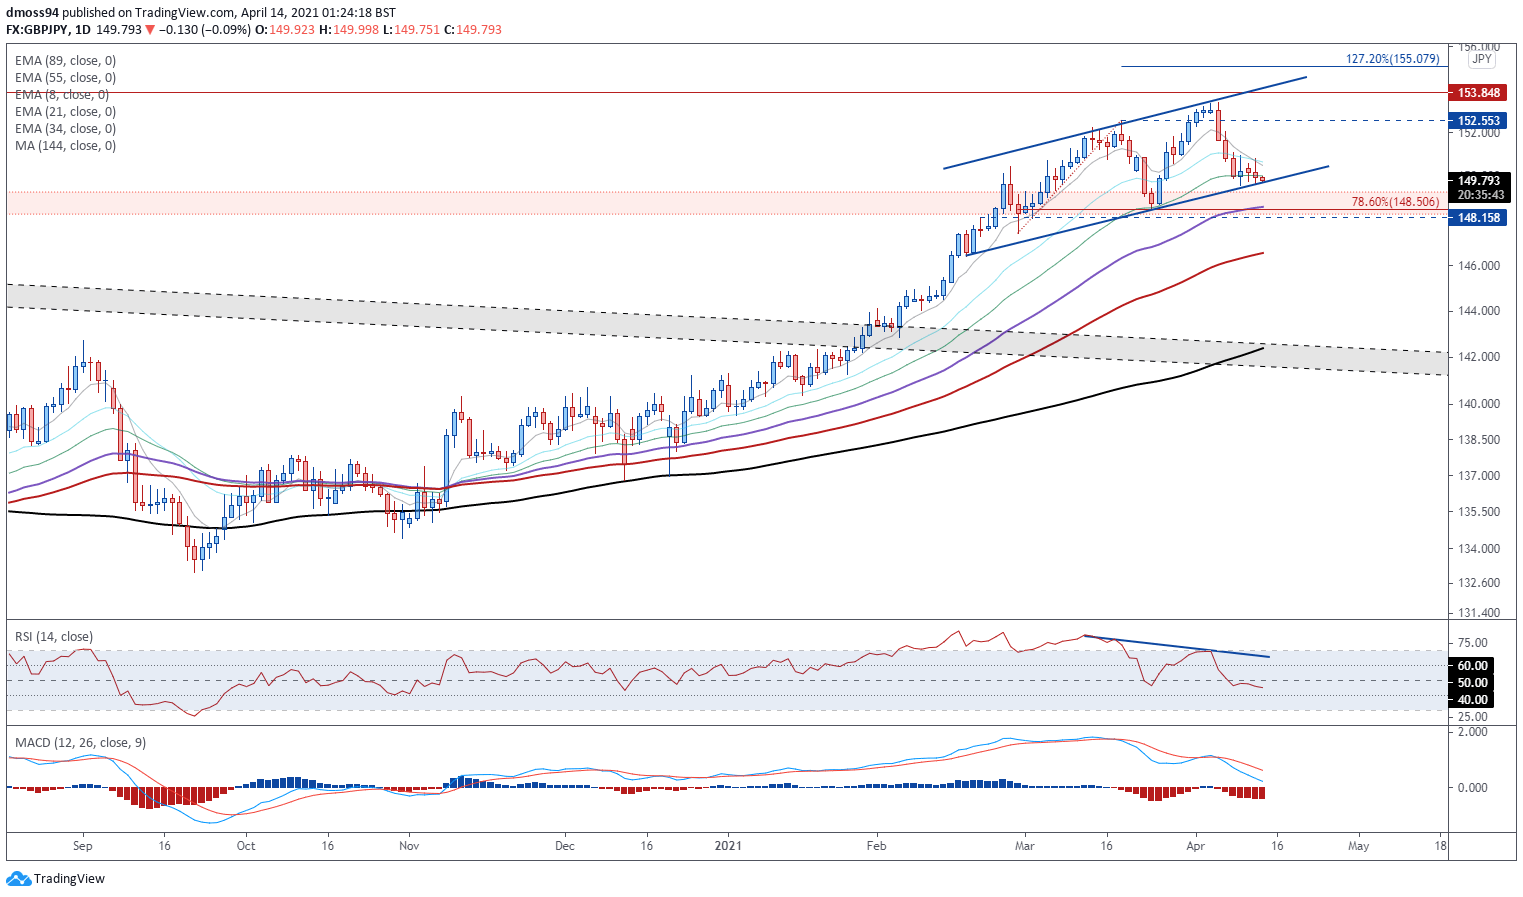
Chart prepared by Daniel Moss, created with Tradingview
On a daily timeframe however, a more extended correction lower could be at hand if Ascending Channel support and the monthly low (149.58) gives way.
Piercing this pivotal level would likely neutralize short-term buying pressure and generate a downside push to probe confluent support at the 78.6% Fibonacci (148.51) and the trend-defining 55-EMA.
However, if 149.50 remains intact, a rebound back towards the yearly high (153.41) seems to be the more likely scenario.
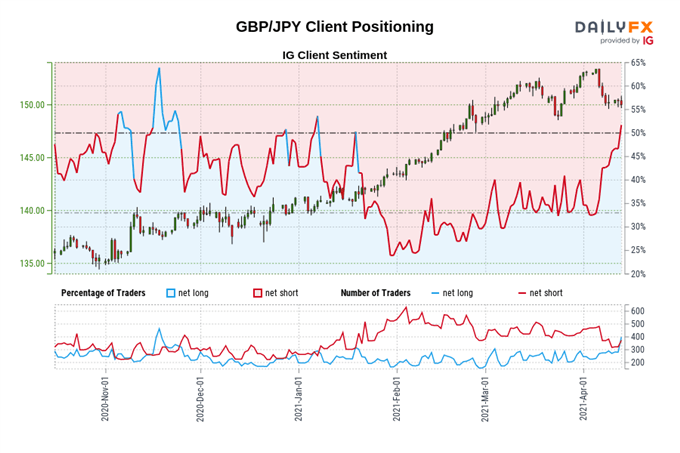
The IG Client Sentiment Report shows 50.14% of traders are net-long with the ratio of traders long to short at 1.01 to 1. The number of traders net-long is 8.89% lower than yesterday and 50.00% higher from last week, while the number of traders net-short is 2.91% lower than yesterday and 19.52% lower from last week.
We typically take a contrarian view to crowd sentiment, and the fact traders are net-long suggests GBP/JPY prices may continue to fall.
Positioning is less net-long than yesterday but more net-long from last week. The combination of current sentiment and recent changes gives us a further mixed GBP/JPY trading bias.
-- Written by Daniel Moss, Analyst for DailyFX
Follow me on Twitter @DanielGMoss


