


Japanese Yen, AUD/JPY, GBP/JPY, USD/JPY, Cycle Analysis – Talking Points:
- Cycle analysis suggests the Japanese Yen may be at risk of extended losses against its major counterparts in the coming months.
- Ascending Triangle hints at gains for AUD/JPY rates.
- Ascending Channel pattern guiding GBP/JPY rates higher.
- Key support at 109.00 holding firm for USD/JPY.

The Japanese Yen has faced significant headwinds in recent weeks, as climbing sovereign bond yields put the carry-trade back in vogue. This dynamic looks set to endure over the near-term and may open the door to further losses for JPY. Here are the key levels for AUD/JPY, GBP/JPY and USD/JPY rates.
Majors-Based Japanese Yen Index Monthly Chart
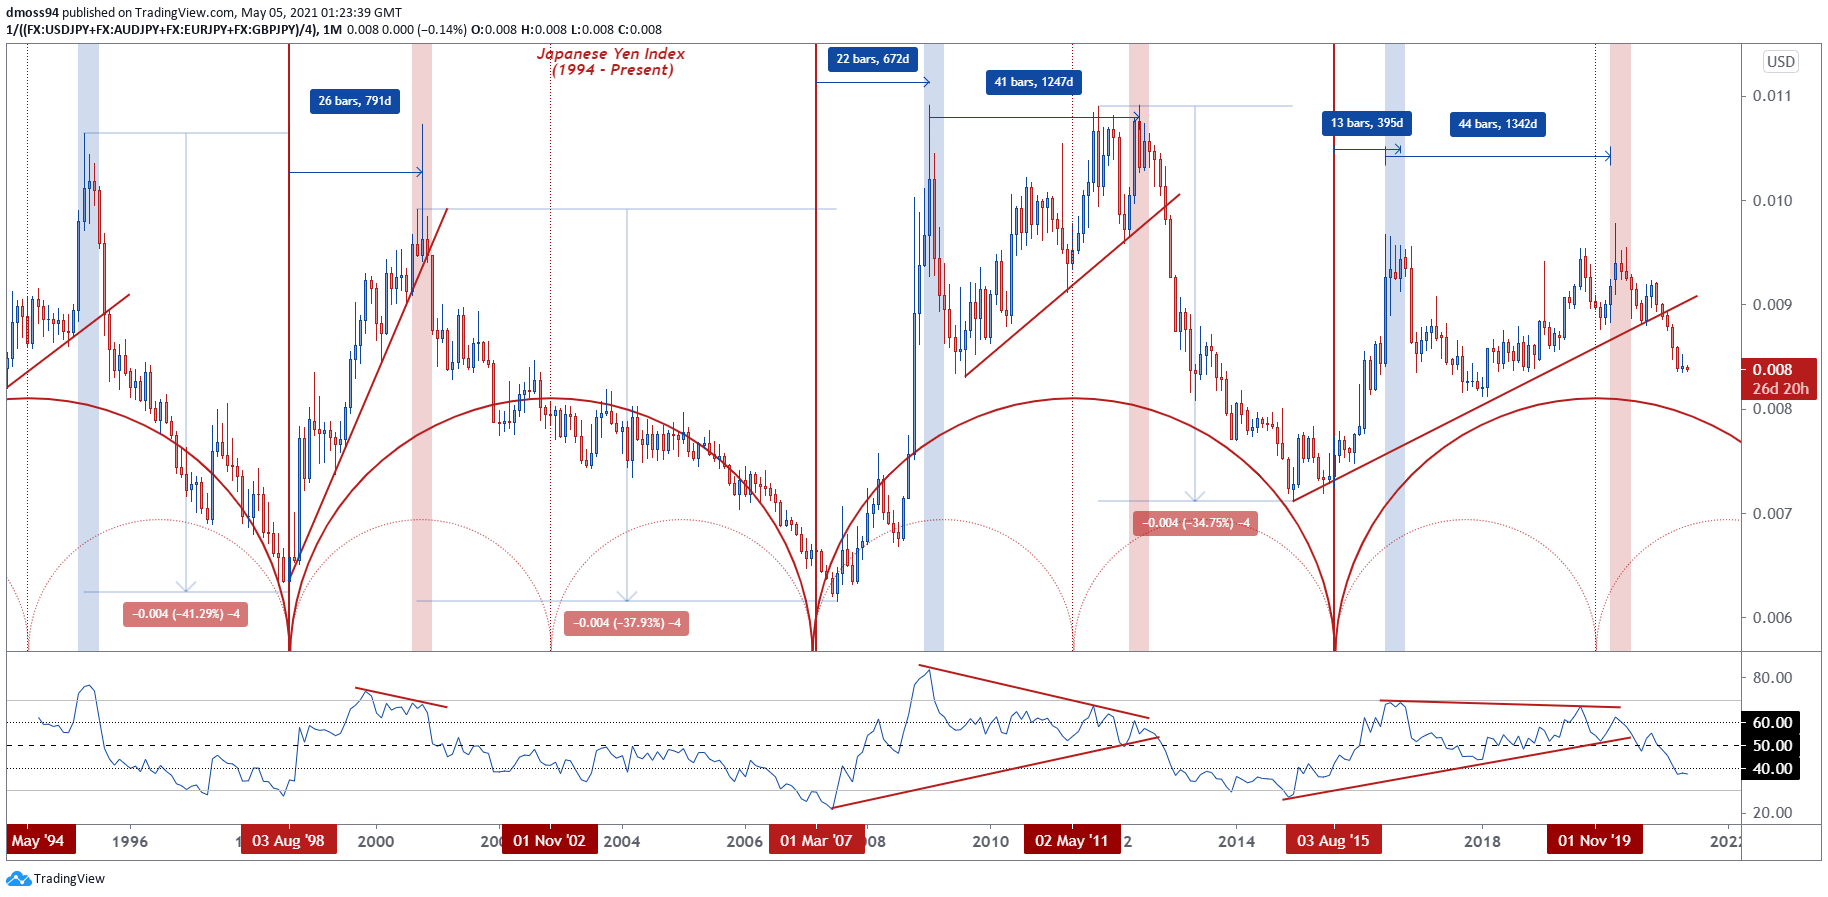
Chart prepared by Daniel Moss, created with Tradingview
*JPY Index averages USD/JPY, AUD/JPY, EUR/JPY, GBP/JPY
The chart above highlights the cyclical pattern displayed by the Japanese Yen over the past 37 years, with the currency largely adhering to what appears to be an 8-and-a-half year rotation. JPY set significant bottoms against its major counterparts in late 1998, early 2007 and late 2015.
After bottoming out, the haven-associated currency then seems to outperform early in the cycle, with key highs posted roughly two years after the 1998 and 2007 lows.
Although the Yen soared to its initial cyclical high just 13 months after the start of the period, the development of price over the last five years looks strikingly similar to the previous bullish cycle.
With that in mind, the convincing break below uptrend support extending from the December 2014 low – combined with the RSI snapping its 73-month uptrend and sliding to its lowest levels in six years – may foreshadow extended losses for JPY in the coming months.
Cycle analysis suggests that the currency could fall an additional 25% from current levels before bottoming out in early 2024.
AUD/JPY Daily Chart – Ascending Triangle in Play

Chart prepared by Daniel Moss, created with Tradingview
AUD/JPY rates appear poised to break higher in the coming days, as prices continue to consolidate within a bullish Ascending Triangle pattern.
With the RSI and MACD indicator tracking above their respective neutral midpoint, and the moving averages stacked in a bullish formation, the path of least resistance seems higher.
A daily close above triangle resistance and the 85.45 handle probably validates bullish potential and clears a path for the exchange rate to fulfil the pattern’s implied measured move (88.29).
However, if resistance holds firm, a pullback to the trend-defining 55-EMA (83.32) could be in the offing.
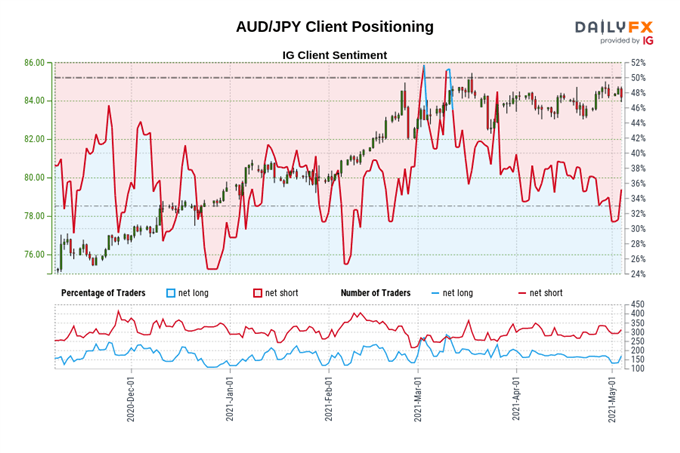
The IG Client Sentiment Report shows 30.48% of traders are net-long with the ratio of traders short to long at 2.28 to 1. The number of traders net-long is 23.35% lower than yesterday and 24.26% lower from last week, while the number of traders net-short is 7.59% lower than yesterday and 15.61% lower from last week.
We typically take a contrarian view to crowd sentiment, and the fact traders are net-short suggests AUD/JPY prices may continue to rise.
Traders are further net-short than yesterday and last week, and the combination of current sentiment and recent changes gives us a stronger AUD/JPY-bullish contrarian trading bias.
GBP/JPY Daily Chart – Ascending Channel Guiding Price Higher
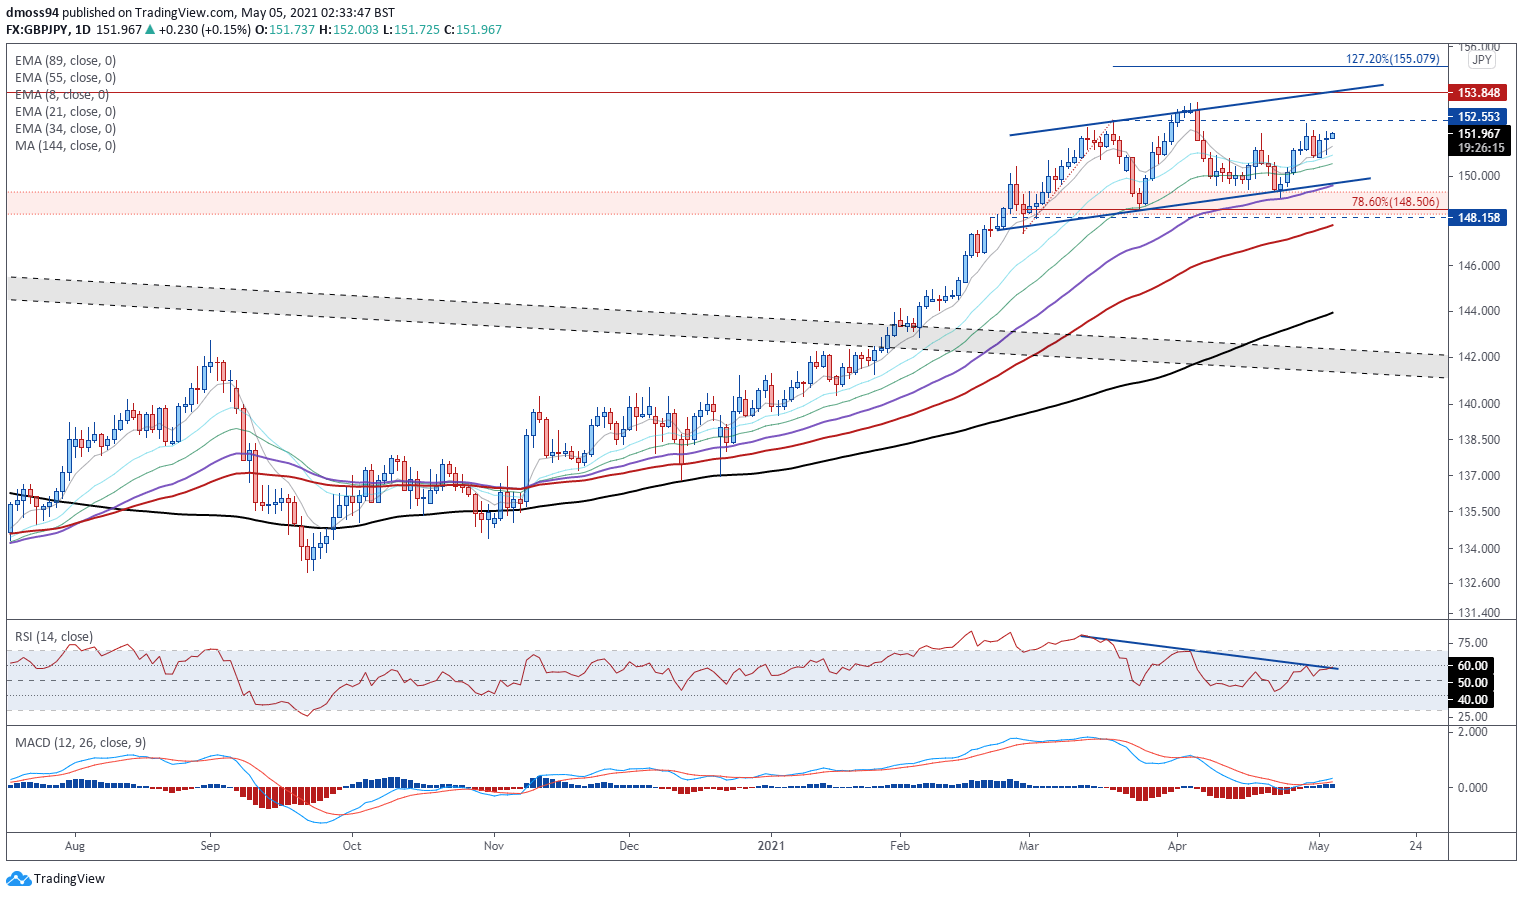
Chart prepared by Daniel Moss, created with Tradingview
The GBP/JPY exchange rate’s technical outlook also remains overtly bullish, as prices track above all six moving averages and within the confines of an Ascending Channel.
A bullish crossover on the MACD, in tandem with the RSI holding above its neutral midpoint, suggests that bulls are still firmly in charge of the exchange rate.
Gaining a firm foothold above 152.55 on a daily close basis would probably precipitate a retest of the yearly high (153.41), with a convincing push above signalling the resumption of the primary uptrend and bringing the 127.2% Fibonacci (155.08) into the crosshairs.
However, if 152.50 neutralizes near-term buying pressure, a downside push back to the trend-defining 55-EMA (149.58) may eventuate.
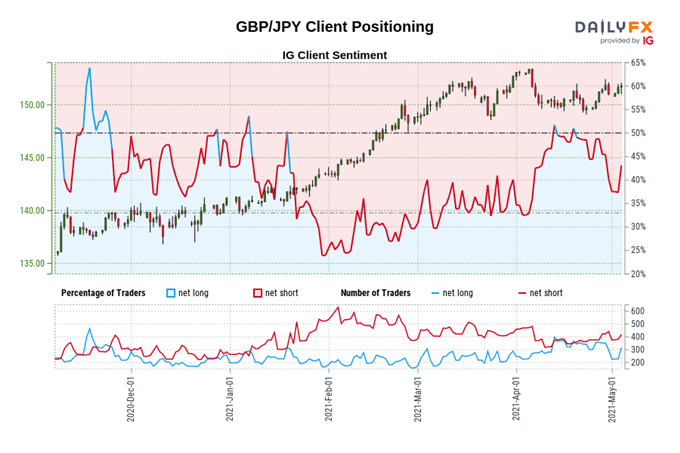
The IG Client Sentiment Report shows 38.04% of traders are net-long with the ratio of traders short to long at 1.63 to 1. The number of traders net-long is 23.20% lower than yesterday and 27.30% lower from last week, while the number of traders net-short is 16.88% lower than yesterday and 1.48% lower from last week.
We typically take a contrarian view to crowd sentiment, and the fact traders are net-short suggests GBP/JPY prices may continue to rise.
Traders are further net-short than yesterday and last week, and the combination of current sentiment and recent changes gives us a stronger GBP/JPY-bullish contrarian trading bias.
USD/JPY Daily Chart – 109.00 Level Capping Downside Potential

Chart prepared by Daniel Moss, created with Tradingview
USD/JPY rates may also extend recent gains, as buyers drive the exchange rate back above the 109.00 handle.
Bullish MA stacking, and the RSI eyeing a push above 60, suggests that further gains are in the offing in the near term.
Ultimately, a daily close above range resistance at 109.60 – 109.85 is needed to trigger a more impulsive upside move and bring the yearly high (110.97) into focus.
On the other hand, sliding back below the 8-EMA (108.98) may intensify selling pressure and carve a path for the exchange rate to retest range support at 108.40 – 108.60.
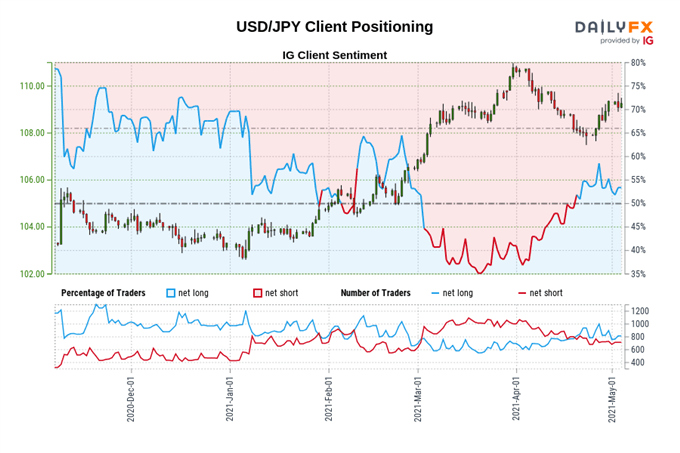
The IG Client Sentiment Report shows 54.31% of traders are net-long with the ratio of traders long to short at 1.19 to 1. The number of traders net-long is 5.42% higher than yesterday and 20.22% lower from last week, while the number of traders net-short is 4.05% higher than yesterday and 3.15% higher from last week.
We typically take a contrarian view to crowd sentiment, and the fact traders are net-long suggests USD/JPY prices may continue to fall.
Positioning is more net-long than yesterday but less net-long from last week. The combination of current sentiment and recent changes gives us a further mixed USD/JPY trading bias.
-- Written by Daniel Moss, Analyst for DailyFX
Follow me on Twitter @DanielGMoss


