


USD/SGD, Singapore Dollar, USD/IDR, Indonesian Rupiah - Talking Points
- USD/SGD is forming Falling Wedge bullish chart pattern
- Daily close higher may reverse USD downtrend vs SGD
- USD/IDR consolidation under falling trend line prolongs
Trade all the major global economic data live as it populates in the economic calendar and follow live coverage for key events listed in the DailyFX Webinars. We’d love to have you along.
Singapore Dollar Technical Outlook
The US Dollar may be preparing to stage a lasting comeback against the Singapore Dollar. This past week, USD/SGD has been aiming cautiously higher after bouncing on the rising support line from February – blue line on the chart below. Recently, prices have turned lower after testing the falling trend line from late September with immediate support at 1.3609.
Taking a closer look reveals what appears to be a Falling Wedge that has been brewing since the beginning of September. This is typically a bullish chart pattern that with an upside breakout, could signal the reversal of the dominant downtrend from late August. In that case, keep an eye on resistance which could stand in the way at 1.3658. Otherwise, a daily close under 1.3558 prolongs the downtrend.
Check out my Singapore Dollar currency profile to learn about how the MAS conducts monetary policy!
USD/SGD Daily Chart
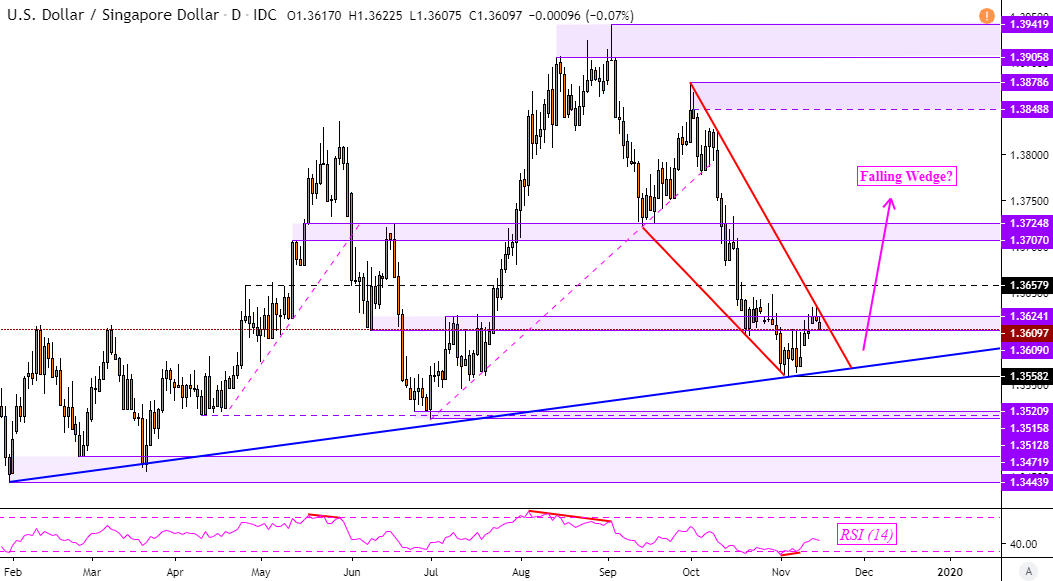
USD/SGD Charts Created in TradingView
Indonesian Rupiah Technical Outlook
The Indonesian Rupiah continues to trade largely sideways against the US Dollar. Though the dominant downtrend in USD/IDR is being kept intact by a falling trend line from April – red line on the chart below. A daily close under the key psychological barrier between 13848 and 13923 opens the door to extending declines. Otherwise, turning higher exposes the October highs (14185 – 14215).
USD/IDR Weekly Chart
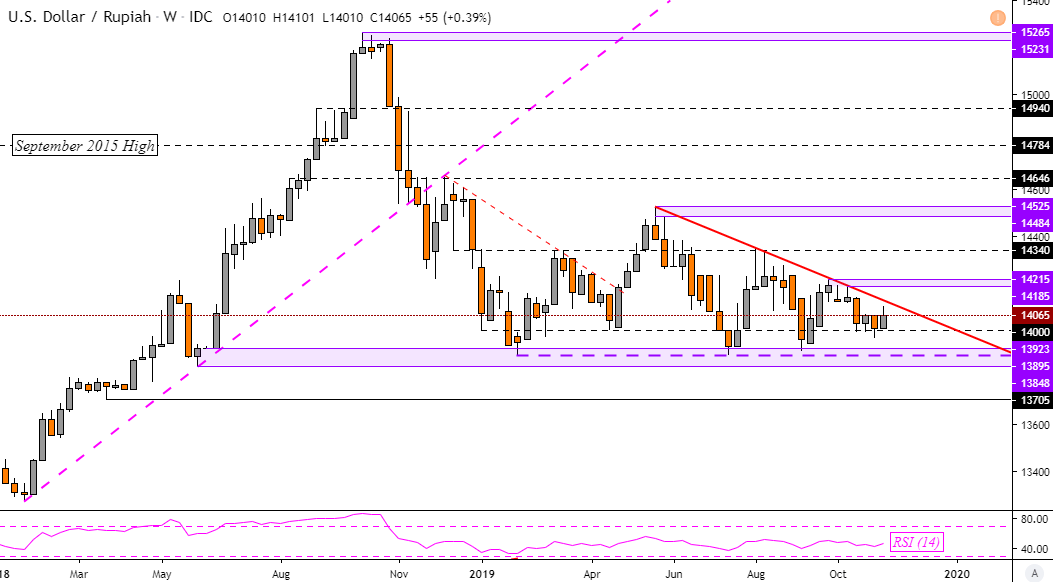
USD/IDR Chart Created in TradingView
FX Trading Resources
- Just getting started? See our beginners’ guide for FX traders
- Having trouble with your strategy? Here’s the #1 mistake that traders make
- See how the US Dollar is viewed by the trading community at the DailyFX Sentiment Page
--- Written by Daniel Dubrovsky, Currency Analyst for DailyFX.com
To contact Daniel, use the comments section below or @ddubrovskyFX on Twitter


