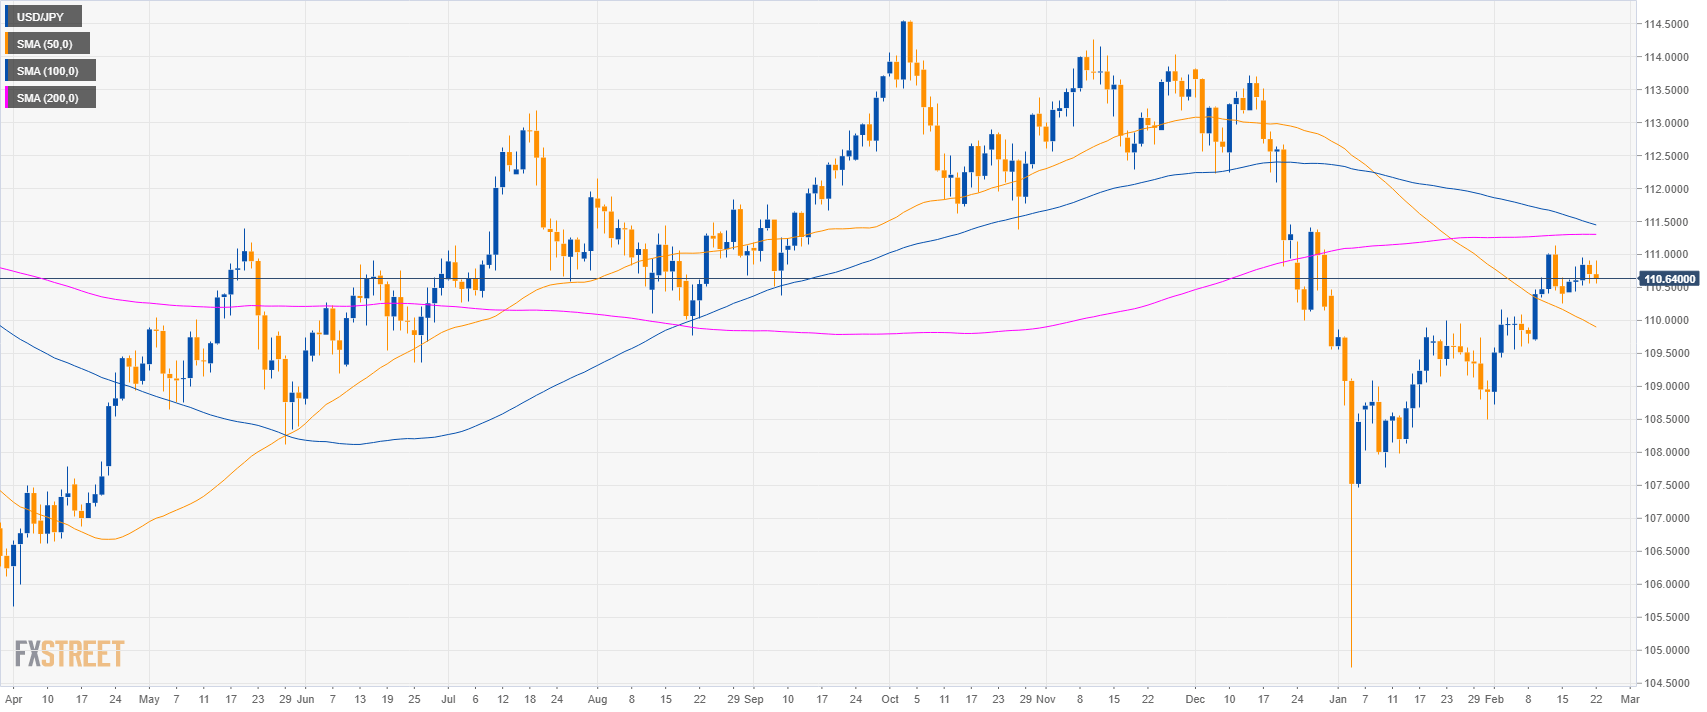
USD/JPY daily chart
- USD/JPY is trading in a deep pullback below the 200-day simple moving averages (SMAs) on the daily chart.
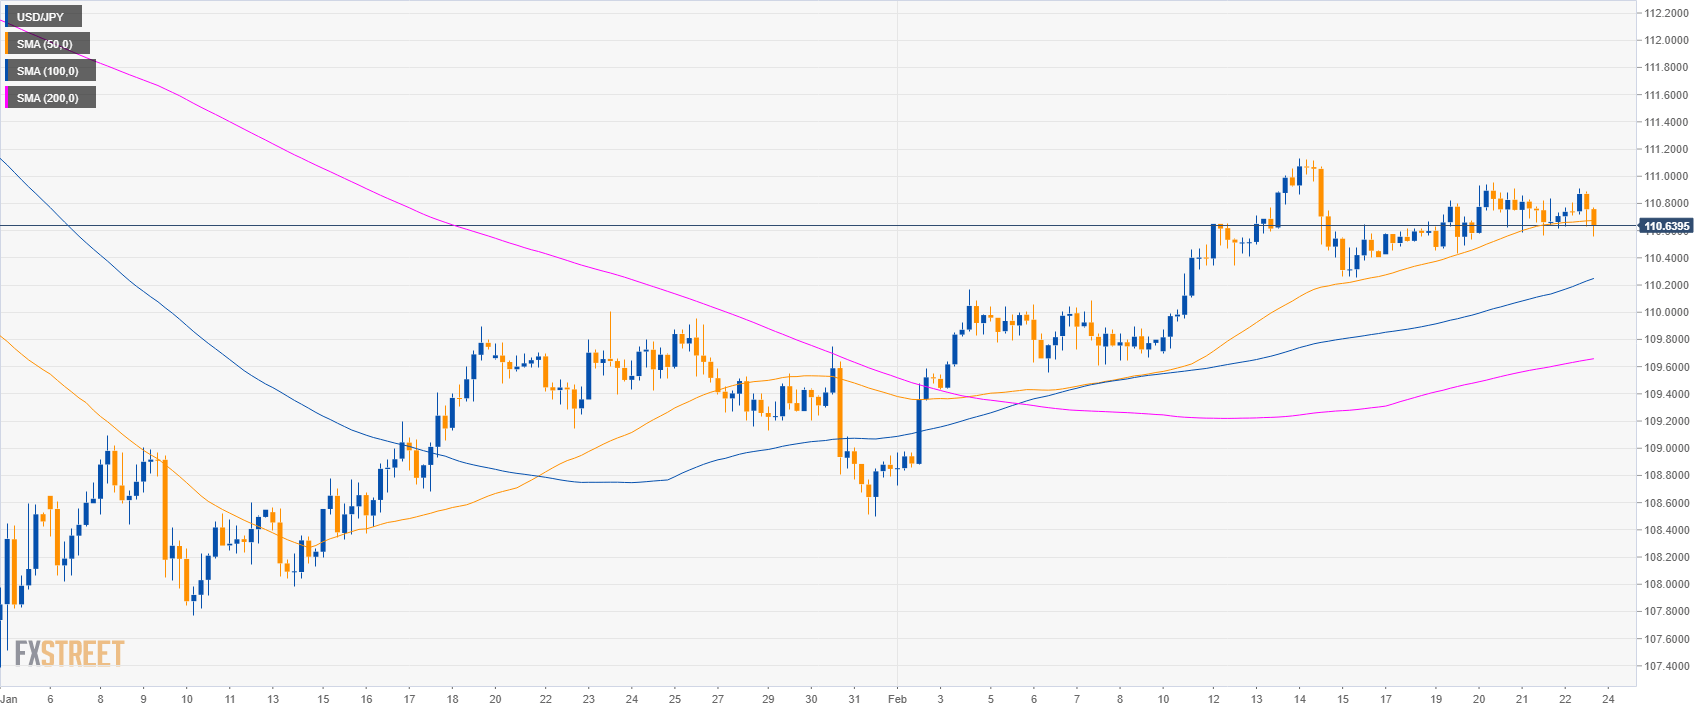
USD/JPY 4-hour chart
- USD/JPY is trading below the 50 SMAs suggesting a weakening of the bullish momentum in the medium-term.
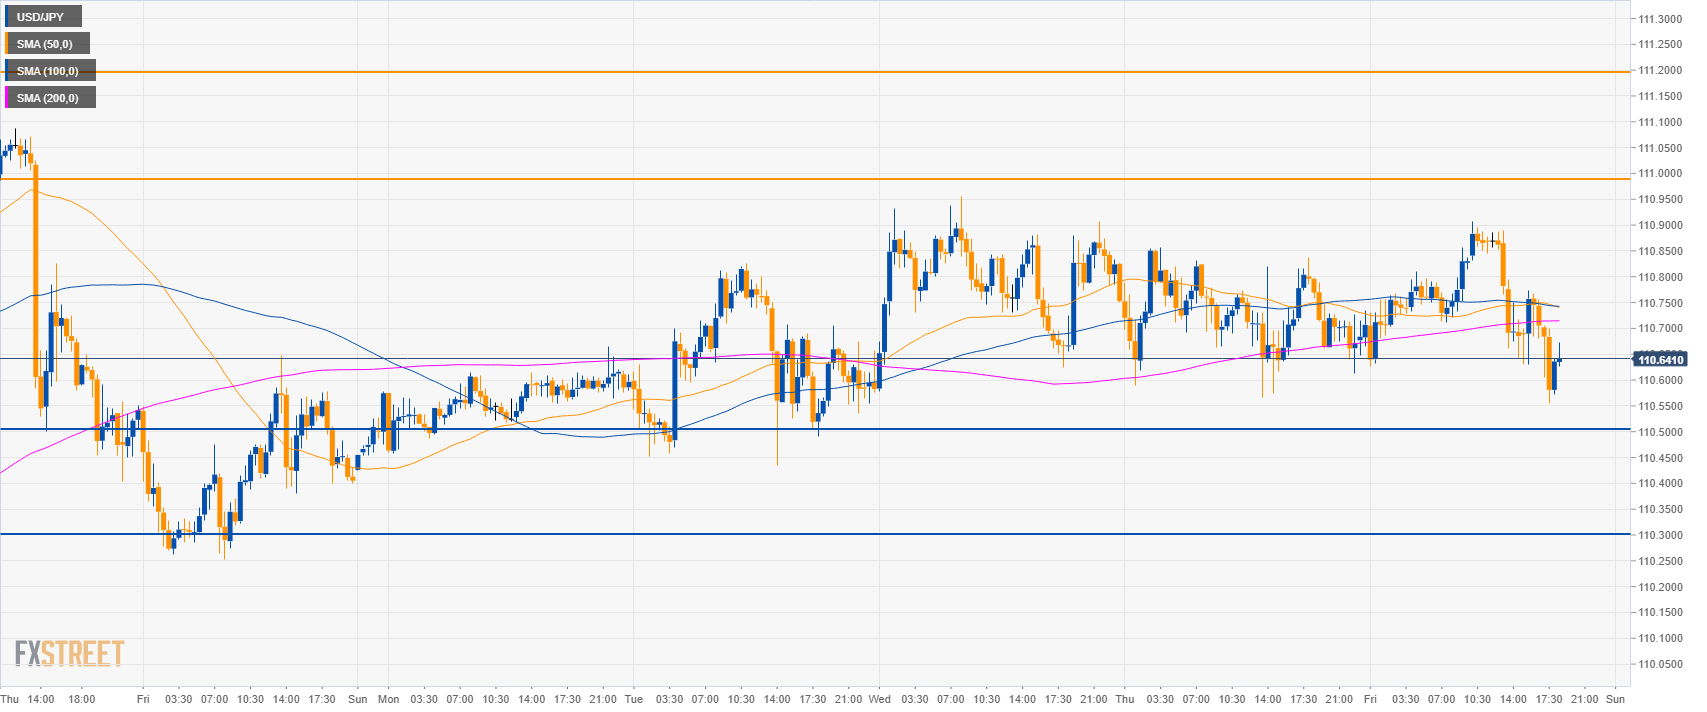
USD/JPY 30-minute chart
- USD/JPY is trading below the main SMAs suggesting bearish momentum in the short-term.
- To the downside, the market can reach 110.50 and 110.30 level in the coming sessions.
- Resistance is at 111.00 and 111.50 level.
Additional key levels:
USD/JPY
Overview:
Today Last Price: 110.66
Today Daily change: -4 pips
Today Daily change %: -0.04%
Today Daily Open: 110.7
Trends:
Daily SMA20: 110.03
Daily SMA50: 109.96
Daily SMA100: 111.48
Daily SMA200: 111.31
Levels:
Previous Daily High: 110.91
Previous Daily Low: 110.57
Previous Weekly High: 111.13
Previous Weekly Low: 109.7
Previous Monthly High: 110
Previous Monthly Low: 104.75
Daily Fibonacci 38.2%: 110.7
Daily Fibonacci 61.8%: 110.78
Daily Pivot Point S1: 110.54
Daily Pivot Point S2: 110.38
Daily Pivot Point S3: 110.2
Daily Pivot Point R1: 110.89
Daily Pivot Point R2: 111.07
Daily Pivot Point R3: 111.23
Note: All information on this page is subject to change. The use of this website constitutes acceptance of our user agreement. Please read our privacy policy and legal disclaimer. Opinions expressed at FXstreet.com are those of the individual authors and do not necessarily represent the opinion of FXstreet.com or its management. Risk Disclosure: Trading foreign exchange on margin carries a high level of risk, and may not be suitable for all investors. The high degree of leverage can work against you as well as for you. Before deciding to invest in foreign exchange you should carefully consider your investment objectives, level of experience, and risk appetite. The possibility exists that you could sustain a loss of some or all of your initial investment and therefore you should not invest money that you cannot afford to lose. You should be aware of all the risks associated with foreign exchange trading, and seek advice from an independent financial advisor if you have any doubts.
Recommended content
Editors’ Picks
AUD/USD bounces back from five-month lows

AUD/USD ends its three-day decline on Wednesday, bouncing back from levels not seen since mid-November. Nevertheless, hawkish remarks from Federal Reserve officials and the influx of safe-haven flows could bolster the US Dollar and potentially limit the upside of pair in the short term.
USD/JPY trades with mild losses below 155.00 on risk-aversion

USD/JPY trades with mild losses near 154.65 on Wednesday during the early Asian trading hours. The robust US economy and sticky inflation data have triggered the expectation that the Fed might delay the easing cycle to September from June, which provides some support to the US Dollar.
Gold ascends but remains shy of testing $2,400 amid hawkish Fed remarks

Gold prices edged higher late in North American session, gaining 0.22% following a hawkish tilt by Fed Chair Jerome Powell. Economic data from the United States was mixed, though Monday’s Retail Sales report and Powell’s remarks kept US Treasury yields higher, capping the yellow metal’s advance.
Fetch.ai Price Prediction: FET must hold above $1.70 for strength
Fetch.ai is trading with a bearish bias. It comes as chatter about the proposed integration with the Ocean Protocol and the SIngularityNET ecosystem remains fresh.
UK CPI March Preview: Inflation pressures to dissipate further, adding to bets of BoE rate cuts

The March UK CPI report will be released by the Office for National Statistics on Wednesday. United Kingdom’s headline and core annual inflation are set to ease in March. The UK CPI report could hint at the BoE’s interest rate cut, rocking the Pound Sterling.