


Advertisement
Trading Journal
May 18, 2016 at 06:48
381 Просмотры
9 Replies
Участник с May 09, 2016
10 комментариев
May 18, 2016 at 06:48
(отредактировано May 18, 2016 at 05:39)
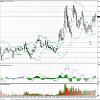
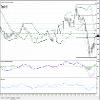
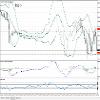
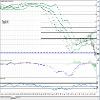
Made a trade on USD/JPY tonight. The signals were aligned well. MACD divergence told me the pair was soon to rise. I saw the opportunity for an entry on a dip from a recent rally at the 38.2% Fibonacci line. The candlesticks also showed long lower wicks with small black and white real bodies, signaling that a reversal was soon to come. However, I was too eager to enter and entered on a slight pullback from the 38.2% Fib. line, at 109.143. Eventually I was stopped out, as the price continued down past the 50% Fib. line, for a loss of 10 pips, accounting for a $0.93 loss. However, quickly after being stopped out, the market shifted and began to make a bullish rally. I re-entered near the same 38.2% Fib. line, at 109.094. The market continued to rally and quickly hit my TP at 109.181. One thing I didn't realize was when using MT4s SL/TP set option under Modify order, the program will set the SL/TP based on the current price, not the price of entry. This is important for the future so that I do not mistakenly thing I have set correct SL/TP levels and then lose more money or take less profit than otherwise expected.

Участник с May 09, 2016
10 комментариев
May 20, 2016 at 16:49
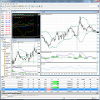
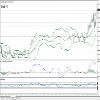
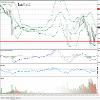
Profitable trade on EUR/USD this morning. Range-bound market allowed for a pretty simple trade setup when the opportunity presented itself. Market was towards the middle BB, then took a bearish turn, despite already being near resistance level at 1.12105. Furthermore, the MACD was nearing a cross, and on the 15-minute chart the price was near the lower BB. I watched the market for some time before seeing some weakness appear on the 1-minute and 5-minute chart. On the 1-minute, the market was slowing and beginning to turn, and this was confirmed by a doji on the 5-minute chart. I waited for a bit more of a bullish move before entering, to ensure that a move bullish move was occurring, and entered at 1.12142. Soon after I entered, a large bullish move pushed the price towards the upper BB and exceeded it slightly. I let the move play out and got out at 1.12191 after the market seemed to be unable to move any higher and began to weaken. Overall, a solid trade that helped me to gain more experience with range-bound markets.
Long/Short: Long
Entry: 1.12105
Exit: 1.12191
Profit/Loss: +8.6 pips
Long/Short: Long
Entry: 1.12105
Exit: 1.12191
Profit/Loss: +8.6 pips
Приложения:
Участник с May 09, 2016
10 комментариев
Jun 07, 2016 at 06:41
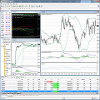
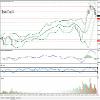
Good couple of trades today, after a streak of losing and taking a break from the market. EUR/USD seemed to be range bound today, so I made several trades using the Bollinger Bands as S/L and T/P levels. With each trades I waited for a MACD divergence and waited for a sell signal from the RSI for the second trade. Not too much to say about the trades, but overall I feel that I need to work on letting the winning trades ride and that should help my profitability greatly. I think I feel too much like I am going to lose the gains that I have and that causes me to get out too quickly. I will research ways to see if the move is losing strength, which should help me recognize weakness when I am in a trade and help me identify possible reversals when I am not in a market position. I also still need to focus on waiting on confirmation before getting into the market. I was right about my second trade of the day being profitable, but I did not wait for confirmation of the move and ended up getting stopped out by a whipsawing move in the market.
Long/Short: 1 Long, 2 Short
Entry: 1.13531, 1.13619, 1.13667
Exit: 1.13600, 1.13680, 1.13635
Profit/Loss: +6.9 pips, -6.1 pips, +3.2 pips = +4 pips
Long/Short: 1 Long, 2 Short
Entry: 1.13531, 1.13619, 1.13667
Exit: 1.13600, 1.13680, 1.13635
Profit/Loss: +6.9 pips, -6.1 pips, +3.2 pips = +4 pips
Приложения:
Участник с May 09, 2016
10 комментариев
Jun 08, 2016 at 06:37
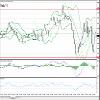
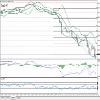
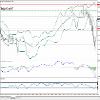
Trade 1: Saw a down trend starting when I got on and a bit of a retracement beginning. Identified my possible entry points, entered when the market touched the 23.6% pivot level and looked to begin to turn around and continue the trend. After entering, price moved higher and stopped me out slightly above the 38.2% pivot level. Overall, a solid trade, but at one point I moved my S/L lower to the parabolic level and then moved it back to its previous level to prevent being stopped out, which I was anyways shortly. Furthermore, I should have waited on more confirmation from my other indicators and from the movement of the price. Overall, not an awful trade, but it certainly could have been done better. DO NOT MOVE THE STOP LOSS FURTHER FROM ENTRY, ONLY CLOSER TO REDUCE RISK AND PROTECT PROFIT.
Trade 2 & 3: Upon further analysis I saw that there was nearly no trend established after some time. On the 30-min chart, the ADX fell to below 25 again and the support and resistance, while tested slightly, did not break in a significant way to warrant the use of trend trading strategies. However, the range was right enough and my trades were taken close enough to the center of the range that within some time I managed to make two trades to even out the loss from the first trade. Yet again I see that the "seconds" do not matter as much as a thorough analysis of the market at a given time. I should spend more time on my macro analysis of the market to make sure of the tools I should be using for trading at a given moment. By realizing that the market was range bound earlier, I could have stopped relying on a retracement and started trading at support and resistance levels for some easy gains. While the mistake did not end up costing me anything, it is one that I will learn from. Furthermore, I was getting angry at several points and walked away from the charts twice. Not a good idea by any means. More discipline, less emotion.
Trade 4: Having realized that the market was not trending but was rather range bound, I set some S/L lines based on the 30-min chart on my 5-min chart and went to analyzing. I saw the price was near support and MACD was rising and decided to go long, with the profit target being near the middle Bollinger Band. I do not believe my analysis was thorough enough, but once in the trade I also saw that the RSI was giving an oversold signal on top of everything else. The trade went smoothly and my TP level was hit after a few minutes, netting me a quick few pips after a day of hard knocks.
Long/Short: 1 Long, 3 Short
Entry: 1.13454, 1.13578, 1.13633, 1.13489
Exit: 1.13570, 1.13575, 1.13520, 1.13565
Profit/Loss: -11.6 pips, +0.3 pips, +11.3 pips, +7.6 pips = +7.6 pips
Приложения:
Участник с May 09, 2016
10 комментариев
Jun 09, 2016 at 06:18
Pre-trading analysis:
Trending or Range Bound?: Range Bound, but a possible breakout appearing
If trending, direction of trend?: Possible trend upwards
If range bound, identify support and resistance levels: 1.13780, 1.13579 (20.1 pip range)
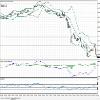
Trade 1: Saw the range bound market near the top giving a strong overbought signal and starting to move downwards on the MACD. I got in near the top of the range and the move was confirmed shortly after with two long black candles. However, immediately after the market sharply turned and I was stopped out. Not much to say, other than it's possible I should have waited for a bit more confirmation. It wasn't easy to keep moving my stop down with the parabolic seeing the market moving a direction it shouldn't have, but overall it was probably for the best, reducing my loss significantly given the chart action that followed. I may attempt a re-entry, as I don't believe the upward movement that the market is showing to be strong enough to start a trend.
Trade 2: Anticipated another turn in the market, but immediately after entry a long white candle appeared, putting me in a losing position very quickly. The move continued upwards and I was eventually stopped out of this position. Very infuriating to have the market immediately turn, but it is what it is and it's out of my control. What is in my control is how I choose to deal with the situation. It is important to analyze why this move was happening instead of getting angry and saying that I'm simply unlucky. Doing a more thorough analysis would have helped me realize my mistakes sooner.
Trade 3: This trade should not have happened, and was by far the worst trade of the day. It was a revenge trade, plain and simple. Entry near the entry of trade 2, and it quickly took the same sour turn as the previous trade. I let my emotions get the better of me during this trade, and it doubled my loss from trade 2 very quickly, plus it set me on a downward spiral for today.
Trade 4: After my previous three mistakes, I took a chance to look back at my 30-min chart. The ADX had risen above 30, indicating that the trend I had seen beginning earlier in the morning was coming to fruition. I took a few moments to look at the 5-min chart, identify some possibly trade opportunities, and took a position in the direction of the trend. However, I should have been more patient and waited for a pullback to enter the trend in a more favorable position, but I was trading emotionally and wanted to make up for lots of lost ground, which is shown in a few minutes.
These next 4 trades should not have happened in the way they did, by any means. They were dangerous, stupid, unjustifiable trades that could have easily led to a far more destructive end than they did. Furthermore, I was so upset that I opened up Hearthstone and began playing while trading, which was an awful Idea.
Trade 5: Yet again I returned to trading against the trend, thinking that the market would merely turn sharply. That was my first mistake. My second mistake was having the conviction and the desire to be right so much so that I increased my lot size from .01 to .02, a risky mistake that could have caused much more severe losses. This is probably one of the worst things I could have done in the situation, and it led to a bad string of trades with the increased trading size. I got out of this position with a profit, but it was probably one of my worst trades to date in terms of the effects on my trading and poor decision making.
Trade 6: I traded with the trend on this trade after a slight pullback to the 23.6% Fib level. However, I still used the increased lot size and did not wait for confirmation, so this was still a poor trade.
Trade 7: I traded another pullback to the 23.6% Fib level, however in this case the price continued down and stopped me out near the 38.2% Fib level. This trade one of the worst trades of the day. I didn't wait for confirmation, moved my stop loss, and continued to use the increased lot size. All very poor decisions. The loss ultimately led me to yet again increase my position size from .02 to .03, which could have been even more disasterous with my state of mind.
Trade 8: I entered the trade near the 38.2% Fib level pullback from the trend, after waiting for confirmation of the continuation of the trend. I was correct, and the market continued to trend upwards, which resulted in a profitable, yet stupid trade. This trade was also more risky than the others in that the market appeared to be consolidating and returning to its range bound state. After the price moving up and down a bit with the entering of a range, the price eventually hit my TP level.
Although I ended with a slight profit today, I made many, MANY mistakes that I will have to be working on in the future. Furthermore, I was not in the profit in terms of pips. Merely the lot size increase managed to put me positive for the day. I am ashamed of these trades and I will make notes of the mistakes to keep on hand in the morning for the rest of the week as a reminder to not repeat what I did today.
Long/Short: 4 Long, 4 Short
Entry: 1.13814, 1.13887, 1.13887, 1.14004, 1.14008, 1.14006, 1.14036, 1.13938
Exit: 1.13869, 1.14001, 1.13999, 1.14036, 1.13986, 1.14067, 1.13924, 1.14045
Profit/Loss: -5.5 pips, -11.4 pips, -11.2 pips, +3.2 pips, +2.2 pips, +6.1 pips, -11.2 pips, +10.7 pips = -17.1 pips
Trending or Range Bound?: Range Bound, but a possible breakout appearing
If trending, direction of trend?: Possible trend upwards
If range bound, identify support and resistance levels: 1.13780, 1.13579 (20.1 pip range)
Trade 1: Saw the range bound market near the top giving a strong overbought signal and starting to move downwards on the MACD. I got in near the top of the range and the move was confirmed shortly after with two long black candles. However, immediately after the market sharply turned and I was stopped out. Not much to say, other than it's possible I should have waited for a bit more confirmation. It wasn't easy to keep moving my stop down with the parabolic seeing the market moving a direction it shouldn't have, but overall it was probably for the best, reducing my loss significantly given the chart action that followed. I may attempt a re-entry, as I don't believe the upward movement that the market is showing to be strong enough to start a trend.
Trade 2: Anticipated another turn in the market, but immediately after entry a long white candle appeared, putting me in a losing position very quickly. The move continued upwards and I was eventually stopped out of this position. Very infuriating to have the market immediately turn, but it is what it is and it's out of my control. What is in my control is how I choose to deal with the situation. It is important to analyze why this move was happening instead of getting angry and saying that I'm simply unlucky. Doing a more thorough analysis would have helped me realize my mistakes sooner.
Trade 3: This trade should not have happened, and was by far the worst trade of the day. It was a revenge trade, plain and simple. Entry near the entry of trade 2, and it quickly took the same sour turn as the previous trade. I let my emotions get the better of me during this trade, and it doubled my loss from trade 2 very quickly, plus it set me on a downward spiral for today.
Trade 4: After my previous three mistakes, I took a chance to look back at my 30-min chart. The ADX had risen above 30, indicating that the trend I had seen beginning earlier in the morning was coming to fruition. I took a few moments to look at the 5-min chart, identify some possibly trade opportunities, and took a position in the direction of the trend. However, I should have been more patient and waited for a pullback to enter the trend in a more favorable position, but I was trading emotionally and wanted to make up for lots of lost ground, which is shown in a few minutes.
These next 4 trades should not have happened in the way they did, by any means. They were dangerous, stupid, unjustifiable trades that could have easily led to a far more destructive end than they did. Furthermore, I was so upset that I opened up Hearthstone and began playing while trading, which was an awful Idea.
Trade 5: Yet again I returned to trading against the trend, thinking that the market would merely turn sharply. That was my first mistake. My second mistake was having the conviction and the desire to be right so much so that I increased my lot size from .01 to .02, a risky mistake that could have caused much more severe losses. This is probably one of the worst things I could have done in the situation, and it led to a bad string of trades with the increased trading size. I got out of this position with a profit, but it was probably one of my worst trades to date in terms of the effects on my trading and poor decision making.
Trade 6: I traded with the trend on this trade after a slight pullback to the 23.6% Fib level. However, I still used the increased lot size and did not wait for confirmation, so this was still a poor trade.
Trade 7: I traded another pullback to the 23.6% Fib level, however in this case the price continued down and stopped me out near the 38.2% Fib level. This trade one of the worst trades of the day. I didn't wait for confirmation, moved my stop loss, and continued to use the increased lot size. All very poor decisions. The loss ultimately led me to yet again increase my position size from .02 to .03, which could have been even more disasterous with my state of mind.
Trade 8: I entered the trade near the 38.2% Fib level pullback from the trend, after waiting for confirmation of the continuation of the trend. I was correct, and the market continued to trend upwards, which resulted in a profitable, yet stupid trade. This trade was also more risky than the others in that the market appeared to be consolidating and returning to its range bound state. After the price moving up and down a bit with the entering of a range, the price eventually hit my TP level.
Although I ended with a slight profit today, I made many, MANY mistakes that I will have to be working on in the future. Furthermore, I was not in the profit in terms of pips. Merely the lot size increase managed to put me positive for the day. I am ashamed of these trades and I will make notes of the mistakes to keep on hand in the morning for the rest of the week as a reminder to not repeat what I did today.
Long/Short: 4 Long, 4 Short
Entry: 1.13814, 1.13887, 1.13887, 1.14004, 1.14008, 1.14006, 1.14036, 1.13938
Exit: 1.13869, 1.14001, 1.13999, 1.14036, 1.13986, 1.14067, 1.13924, 1.14045
Profit/Loss: -5.5 pips, -11.4 pips, -11.2 pips, +3.2 pips, +2.2 pips, +6.1 pips, -11.2 pips, +10.7 pips = -17.1 pips
Приложения:
Участник с May 09, 2016
10 комментариев
Jun 10, 2016 at 06:40
Pre-trading analysis:
Trending or Range Bound?: Trending
If trending, direction of trend?: Bearish trend
If range bound, identify support and resistance levels: N/A
Trade 1: Much better trade today already than yesterday. Took more time this morning for market analysis and identification of the state of the market. The EURUSD seemed to be in a bearish trend, likely following subpar interest rate talk from President Draghi. Whatever the reason, the clear down trend was quite strong. However, when I opened the charts this morning, I could see that there was a possible pullback forming near the 23.6% Fib level of the move. Furthermore, RSI was close to 60, high for a down trend, and the MACD was beginning to tick down and turn negative again, so I took a position near the middle Bollinger band. The down trend continued quickly and I took profit near the lower Bollinger band, which was coupled with the S2 pivot. The only things I think I could have done better with these trades were not moving my TP level around so much and possibly doing a bit macro market analysis before entering a trade. Overall, off to a much better start than yesterday by far.
Trade 2: Another good trade, although not quite as good as the previous one. Waited for another pullback on the trend for re-entry, however this time the pullback was not even quite strong enough to rech the 23.6% Fib level. Furthermore, the RSI did not reach the 60 level as resistance, but rather reached barely over the 40 level. The MACD was also only slightly above zero but began to turn. I was a bit skeptical of the position, but given the strong downward trend, I entered after confirmation of further downward movement. This time, however, with the strength of the trend and with the previous trade in mind, I decided to set my TP level lower and keep it there. Normally, in trending markets, I've found that I don't let my winning trades ride as long as I should, so I aimed for about a 20% lower stop than usual. After only a few minutes, the MACD crossed the zero line and a long black candle confirmed the move I had anticipated. Price hit my TP level fairly quickly and I ended with a solid, above average profit. The only thing I can think of that I did poorly with this trade was briefly hesitating on my stop loss being where it was, despite not ever moving it, and possibly entering on suboptimal signals. However, in the scenario of a strong trend, I think suboptimal signals, as long as they are in the direction of the trend, can be acted upon with relatively low risk.
As a celebration of the trades today finally putting my account back in profit after a string of poor trades last Friday, as well as being exhausted from a consistent 4 hours of sleep, I'll be taking the rest of the trading day off. Here's to trading with the trend.
Long/Short: 2 Short
Entry: 1.13407, 1.13206
Exit: 1.13311, 1.13078
Profit/Loss: +9.6 pips, +12.8 pips = +22.4 pips
Приложения:
Участник с May 09, 2016
10 комментариев
Jun 11, 2016 at 11:36
Pre-trading analysis:
Trending or Range Bound?: Range Bound
If trending, direction of trend?: N/A
If range bound, identify support and resistance levels: 1.13158, 1.12859 - 29.9 pip range
Trade 1: Saw the price nearing the support, as well as the MACD turning upwards and the RSI turning from near 70. Decided to get in for a range trade. The market turned upward, but the upward move was quick and did not last as long or go as far as I expected it to. Given the speed of the rise in price and the confirmation of strength by the indicators, I thought that the downward turn was merely a quick retracement before the move would continue higher. I began to move my stop higher using the parabolic method to better maintain my position and lower my risk. The downward turn continued and eventually my stop loss was hit, about 50% of the way towards my entry. The trade was a good trade, despite being a losing one. I did almost everything right. Perhaps the only thing I could have done differently was not being greedy about moving my TP level around so much. However, given the strength of the signals, I felt that being a bit greedy was justified in the situation, as my analysis led me to believe the move should have continued further, probably to the resistance point about another 15 pips above where the matrket turned.
Trade 2: Re-entered long for this trade. It was not an easy trade for me to stick with. The market turned very choppy and messy, which is something I never like to trade in. However, my signals yet again repeated and indicated that the market should turn higher, so I entered after a bit of confirmation, slightly higher than the entry for my previous trade. The trade turned directions several times and it was very difficult for me to not want to get out at several points. After a long, difficult trade, the market moved higher as predicted and my TP level was hit. A good trade again, albeit testing my limits of my trust in my system.
Trade 3: Moved my support and resistance levels to better reflect recent market movement. The move that I predicted for the first two trades was coming to an end near the resistance level that I set, and the MACD and RSI were beginning to turn in a bearish direction. I took a short position after waiting for some confirmation. The very next candle was a massive black candle and it quickly hit my TP level near the support. Another good trade that was quickly rewarded.
Long/Short: 2 Long, 1 Short
Entry: 1.12904, 1.12904, 1.12959
Exit: 1.12835, 1.12982, 1.12868
Profit/Loss: -6.9 pips, +7.8 pips, +9.1 pips
Приложения:
Участник с May 09, 2016
10 комментариев
Jun 14, 2016 at 07:40
Pre-trading analysis:
Trending or Range Bound?: Ending trending, beginning range bound
If trending, direction of trend?: Bullish trend ending
If range bound, identify support and resistance levels: 1.12711 - 1.12422
Trade 1: A trade I really should not have taken, but not a bad trade. The market seemed to be transitioning from trending to range bound. I believed that the range had already been set on the chart fairly well. The price appeared to be nearing the bottom of the range, so I went long. However, given my uncertainty about the state of the market, as well as the messy nature of the appearance of the chart, I do not believe I should have taken the trade. Set my SL level just below the most recent low, and soon a long black candle hit my stop. I should have most likely waited longer before taking a trade.
Trade 2: A better trade, in the same direction as the first. RSI had dipped below 30 and was turning, as well as MACD beginning to signal that the downward move was finished and a bullish move was approaching. I got in, again near the resistance levels, after I had moved them to better fit the market. A few minutes after my entry, a massive bullish movement occurred. At time of writing, the move has continued a good 20 pips past my TP level. Good analysis, but perhaps too early of an entry. Other than that, a solid trade.
Trade 3: After the rapid move up from the previous trade and waiting for some time, RSI rose above 70 and began to turn, with the confirmation from the MACD turning around. However, the market did not react by price falling as expected. Instead, the price rose and continued further. This was not expected, but the trade was fine. I stayed in my position, and was eventually stopped out, but not an emotional trade by any means. Despite the loss, a still solid trade.
Trade 4: At this point, the price was diverging from the MACD and RSI, telling me that there was a good chance of a reversal occurring. I waited for some confirmation of a bearish move and entered. The market was a bit choppy at this point, as it was about 10:30 and many traders had likely already left the market, so the low volume did not allow price to swing as rapidly as it had earlier in the day. The market moved steadily lower, and eventually I was in winning position that put me just slightly above even with the loss of the previous trade. Given the low volume, as the trade was completed around 11:00, the close of the London session, I decided to get out of my position. It was likely a strong position, but it would have been risky to be trading in the market outside of the overlap of the NY and London session. Another good trade on an analysis confirmed.
Long/Short: 2 Long, 2 Short
Entry: 1.12585, 1.12453, 1.12863, 1.12984
Exit: 1.12480, 1.12602, 1.12985, 1.12851
Profit/Loss: -10.5 pips, +14.9 pips, -12.2 pips, +13.3 pips = +5.5 pips
Приложения:
Участник с May 09, 2016
10 комментариев
Jun 15, 2016 at 07:06
Pre-trading analysis:
Trending or Range Bound?: Trending
If trending, direction of trend?: Bearish
If range bound, identify support and resistance levels: N/A
Trade 1: Shorted on a pullback to the 38.2% Fib level. The trade quickly went my direction. I saw the push downward begin to exhaust and MACD turning, so I got out before my TP level was
hit. Not a bad trade, but I probably should have stayed in the trade longer to accumulate more profits.
Trade 2: Went long on what I expected to be a slight pullback quickly after the first trade. Was quickly punished for my rash decision making when the market turned sharply. Bad trade.
Trade 3: Stupidly hit the buy button instead of the sell button. Luckily a market swing got me out with a $0.02 profit. BE CAREFUL when placing orders.
Trade 4: Shorted, but not in the best place to short. Fairly week position, did not want the market to pull back because of the weak position, got out with a small profit.
Trade 5: Shorted, not a good place to short. Momentum from the move had died and I ended up losing 10 pips on the trade. Should have waited for confirmation of the continuation of the
move.
What ultimately turned this day sour was trading against the trend. More risk + less potential profit should mean much tighter stops and lower TP levels. Keep this in mind and avoid
trading against the trend if possible to begin with.
Long/Short: 2 Long, 3 Short
Entry: 1.12081, 1.12039, 1.11963, 1.11979, 1.12022
Exit: 1.12030, 1.11963, 1.11965, 1.11941, 1.12124
Profit/Loss: +5.1 pips, -7.6 pips, +0.2 pips, +3.8 pips, -10.2 pips = -8.7 pips
Приложения:

*Коммерческое использование и спам не допускаются и могут привести к аннулированию аккаунта.
Совет: Размещенные изображения или ссылки на Youtube автоматически вставляются в ваше сообщение!
Совет: введите знак @ для автоматического заполнения имени пользователя, участвующего в этом обсуждении.


