


Hammer
Oct 06, 2014 at 06:46
4,138 視聴
12 Replies

forex_trader_225338
Jan 08, 2015からメンバー
2 投稿
Jan 12, 2015 at 15:59
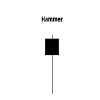
A hammer is a very significant candle, I see it as an entry signal depending on the trend of the pair in question (only for uptrend though), if on the daily chart the trend is up, I always fancy entering a trade after a hammer on the daily, my stop will usually go underneath the hammer. I understand every trader is different and I'm happy to read anyone's view on this.
Mar 16, 2021からメンバー
477 投稿
May 01, 2021 at 00:34
The hammer is usually seen when trying to change one trend and run another. Again the hammer can be seen from the swing point.
Jul 20, 2020からメンバー
399 投稿
May 15, 2021 at 14:10
Ive always like this candle pattern. The logic behind it is sound. The pressure from either side of the market has to be respected
Jan 22, 2021からメンバー
125 投稿
May 25, 2021 at 08:54
Hammers take the point when, there is long downtrend and generally, it is a bullish reversal candle but must confirmed with next candlestick pattern.
Mar 16, 2021からメンバー
477 投稿
May 26, 2021 at 00:58
blackChelsea posted:Yes. The hammer provides the signal to create the swing point. And the role of the hammer in reversal is a lot.
Hammers take the point when, there is long downtrend and generally, it is a bullish reversal candle but must confirmed with next candlestick pattern.

Aug 25, 2021からメンバー
1 投稿
Aug 27, 2021 at 16:35
Yes. The hammer provides the signal to create the swing point. And the role of the hammer in reversal is a lot.
Jul 20, 2020からメンバー
399 投稿
Sep 22, 2021 at 06:54
It is definitely a solid indication but has to be a part of a much wider strategy. There is bias, market structure and timeframe of hammer too. But i definitely like it
May 11, 2020からメンバー
21 投稿
Dec 02, 2021 at 14:05
In my opinion, hammer pattern greatly helps traders to determine the entry point. I always try to find whether bearish or bullish hammers in order to understand is it right time to enter the position or not. Of course, the vast majority of traders prefers to check the trends and support/level resistance, however I combine everything and I handle the task of finding a proper entry point. Moreover, sometimes you can determine the exit point due to hammers
So, I guess that it's a very universal pattern which should be learnt by novices.
So, I guess that it's a very universal pattern which should be learnt by novices.


*商用利用やスパムは容認されていないので、アカウントが停止される可能性があります。
ヒント:画像/YouTubeのURLを投稿すると自動的に埋め込まれます!
ヒント:この討論に参加しているユーザー名をオートコンプリートするには、@記号を入力します。


