


Typical Price Congestion on the daily Chart
Mar 14 at 15:39
102 Visualizações
2 Replies

Membro Desde Sep 01, 2022
23 postagens
Mar 14 at 15:39
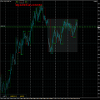
This is a typical congestion, where prices bounce back at the high of the measuring bar.
NZD/CHF - daily chart, congestion with 12 bars.
On the chart the daily congestion is displayed on the 4 hr chart.
There are blocks around each daily chart bar.
NZD/CHF - daily chart, congestion with 12 bars.
On the chart the daily congestion is displayed on the 4 hr chart.
There are blocks around each daily chart bar.
Anexos :
A little bit of knowledge is a dangerous thing!
Membro Desde Sep 01, 2022
23 postagens
Mar 15 at 12:16
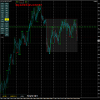
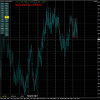
NZD/CHF - daily congestion with 13 bars today.
as so many times, prices trade back into the congestion between bar 11 and bar 17.
Again displayed on the 4 hr chart, showing the congestion high/low of the daily (red lines) surrounded by blocks to show what 4 hr bars belong to the daily bar.
as so many times, prices trade back into the congestion between bar 11 and bar 17.
Again displayed on the 4 hr chart, showing the congestion high/low of the daily (red lines) surrounded by blocks to show what 4 hr bars belong to the daily bar.
Anexos :
A little bit of knowledge is a dangerous thing!

*Não serão tolerados uso comercial ou spam. O não cumprimento desta regra poderá resultar na exclusão da conta.
Dica: Ao adicionar uma URL de imagem/youtube, você estará automaticamente incorporando-a à sua postagem!
Dica: Digite o símbolo @ para que o nome de um usuário que participe desta discussão seja completado automaticamente.


