


Typical Price Congestion on the daily Chart
Mar 14 at 15:39
103 व्यू
2 Replies

तबसे मेंबर है Sep 01, 2022
23 पोस्टों
Mar 14 at 15:39
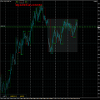
This is a typical congestion, where prices bounce back at the high of the measuring bar.
NZD/CHF - daily chart, congestion with 12 bars.
On the chart the daily congestion is displayed on the 4 hr chart.
There are blocks around each daily chart bar.
NZD/CHF - daily chart, congestion with 12 bars.
On the chart the daily congestion is displayed on the 4 hr chart.
There are blocks around each daily chart bar.
अटैचमेंट :
A little bit of knowledge is a dangerous thing!
तबसे मेंबर है Sep 01, 2022
23 पोस्टों
Mar 15 at 12:16
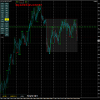
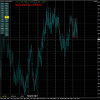
NZD/CHF - daily congestion with 13 bars today.
as so many times, prices trade back into the congestion between bar 11 and bar 17.
Again displayed on the 4 hr chart, showing the congestion high/low of the daily (red lines) surrounded by blocks to show what 4 hr bars belong to the daily bar.
as so many times, prices trade back into the congestion between bar 11 and bar 17.
Again displayed on the 4 hr chart, showing the congestion high/low of the daily (red lines) surrounded by blocks to show what 4 hr bars belong to the daily bar.
अटैचमेंट :
A little bit of knowledge is a dangerous thing!

*व्यवसायिक इस्तेमाल और स्पैम को ब्रदाश नहीं किया जाएगा, और इसका परिणाम खाता को बन्द करना भी हो सकता है.
टिप: किसी चित्र या यूट्यूब या URL को पोस्ट करने से वे अपने आप आपके पोस्ट में आजाएगा!
टिप: @ चिन्ह को टाइप करें उपभोगता के नाम को अपने आप करने के लिए जो इस चर्चा में भाग ले रहा है.


