


EUR/USD

Nov 21, 2011 부터 멤버
게시물1718
Apr 30, 2015 at 08:12
takechance posted:
Bearish divergence exists......still bearish on EUR/USD at the moment.
Interesting:
첨부 파일:

Apr 30, 2015 at 08:36
Since the start of April the EURUSD rose more than 3.0% and is in a recovery phase since late April, trading well above the 10-day moving average. Yesterday the pair rose with above average volume and close in the middle of the daily range. Stochastic is showing an overbought market but even with the pair well into overbought territory, we should not fight the strong upward correction just yet.
"I trade to make money not to be right."
Apr 30, 2015 at 12:08
honeill posted:
Since the start of April the EURUSD rose more than 3.0% and is in a recovery phase since late April, trading well above the 10-day moving average. Yesterday the pair rose with above average volume and close in the middle of the daily range. Stochastic is showing an overbought market but even with the pair well into overbought territory, we should not fight the strong upward correction just yet.
I agree, with mixed Euro results already behind, now we are waiting for the US data.
Nov 21, 2011 부터 멤버
게시물1718
Apr 30, 2015 at 12:28
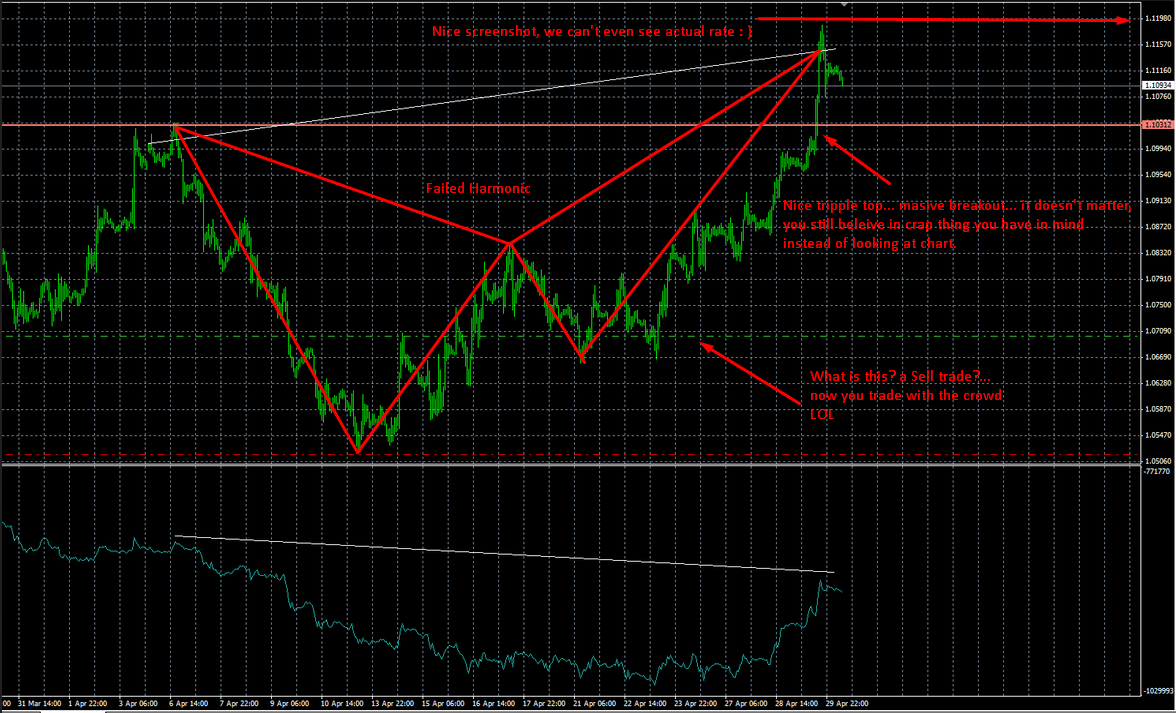
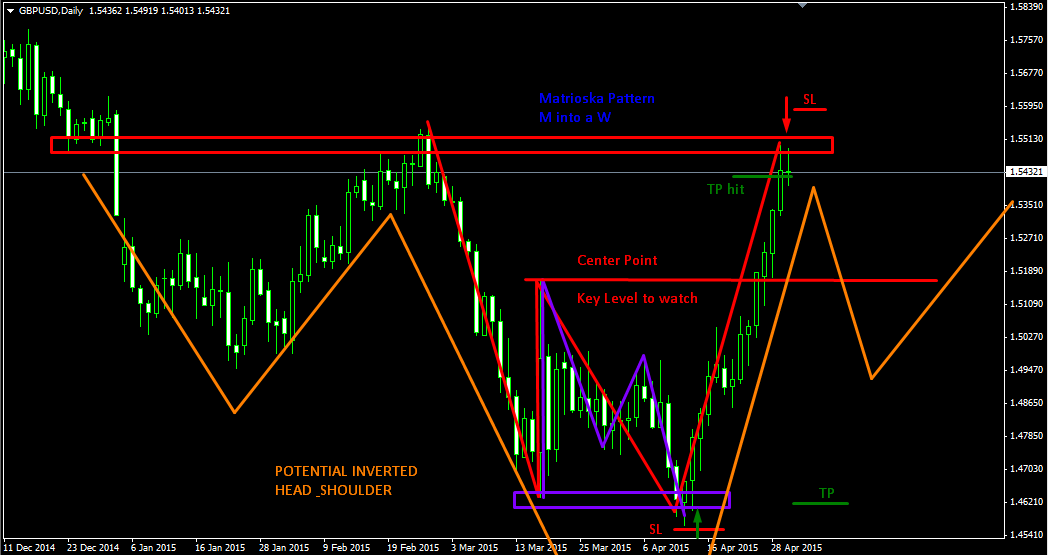
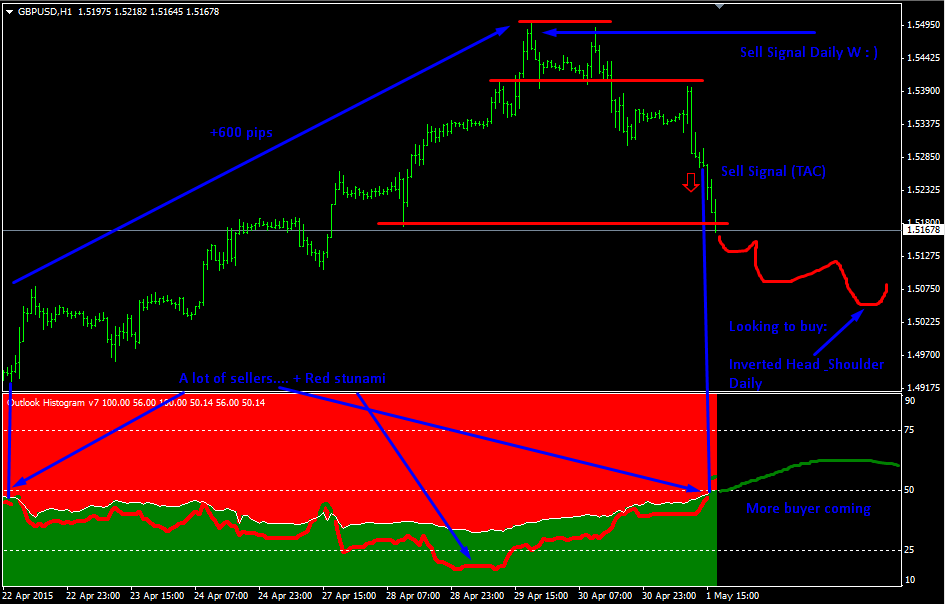
Where is GBPUSD thread?
첨부 파일:

Apr 30, 2015 at 15:21
EUR / USD rose to the weak US GDP report.
It broke above the main resistance line (now turned into support) 1.1045 and hit resistance near 1.1180.
The short term trend is positive.
On the daily chart, the break above 1.1045 marked the conclusion of a possible double bottom something that could represent broader bullish extensions.
It broke above the main resistance line (now turned into support) 1.1045 and hit resistance near 1.1180.
The short term trend is positive.
On the daily chart, the break above 1.1045 marked the conclusion of a possible double bottom something that could represent broader bullish extensions.

Jul 10, 2014 부터 멤버
게시물1117
Apr 30, 2015 at 15:24
EUR/USD is still testing the resistance around 1.1230 and I think it is possible for it to break above that level. Should it manage to do so next target is likely 1.1700 - 1.1800.
Nov 21, 2011 부터 멤버
게시물1718
Apr 30, 2015 at 15:27
victoriajensen posted:Lol
I think it is possible
Nothing is impossible on Forex Market
Jun 08, 2014 부터 멤버
게시물454
Apr 30, 2015 at 18:51
The EUR/USD continue to have a a healthy uptrend and breaking the resistance lines lets see if the price will be able to break the resistance 1.1230 on the 4 hours chart.


Oct 11, 2013 부터 멤버
게시물775
Apr 30, 2015 at 19:56
Good rally on the EURUSD, the 1.1200 level has been broken, but lets pay attention to a possible pullback maybe for next week.
Oct 08, 2011 부터 멤버
게시물137
May 01, 2015 at 07:30
As I have mentioned earlier this week, it takes a price-bar on the daily chart where open and close price are outside the high of the measuring bar (1.1040) in order to nullify the trading range.
Yesterday's bar has both (open & closed) outside, so the range can be disregarded.
After this fact, a hook on the daily chart can be expected.
A hook (in an up-trend) is generated by a price bar, that fails to trade to a new high as compared to the preceding bar.
Many professional traders (fund managers) prefer to trade the first hook after the range breakout - as it is a confirmation of the new trend direction after the major entry signal (that I posted last week), inside the trading range.
The first hook is also called 'trend-confirmation-hook' and historically has more thrust than all other major entry signals.
The entry I posted this week off the weekly chart, in the meantime is already 200 pips plus.
"a little bit of knowledge is a dangerous thing"
Oct 08, 2011 부터 멤버
게시물137
May 01, 2015 at 08:00
Count 'price bars' instead of 'time passed' when trading.
Any decent and successful trade lasts about 4 to 8 bars as an average, regardless of the chart time-frame.
If this is done on the 5 min chart, the trade lasts only about 20 to 40 minutes.
When it is done on the daily chart, it means 4 to 8 days, or 4 to 8 weeks on the weekly chart.
This is very important to realize!
Traders who are not aware of this, often close good positions much too early and leave a lot of money on the table.
This is also very important to realize when in a losing position (called 'time-stop')
If one is in a losing position and prices do not return back to the entry price within 3 to 4 bars, it is almost always a good decision to close the position with a small loss, rather than waiting - and hoping - that prices will turn back into the trade-direction.
Traders who are not aware of this often create these massive 'draw-downs', and sometimes are lucky enough, not to get a margin call.
This is the simple concept to
KEEP YOUR LOSSES SMALL AND LET YOUR PROFITS RUN!
"a little bit of knowledge is a dangerous thing"

forex_trader_236107
Mar 10, 2015 부터 멤버
게시물116
May 01, 2015 at 08:27
PERPETUUMMOBILE posted:
Count 'price bars' instead of 'time passed' when trading.
Any decent and successful trade lasts about 4 to 8 bars as an average, regardless of the chart time-frame.
If this is done on the 5 min chart, the trade lasts only about 20 to 40 minutes.
When it is done on the daily chart, it means 4 to 8 days, or 4 to 8 weeks on the weekly chart.
This is very important to realize!
Traders who are not aware of this, often close good positions much too early and leave a lot of money on the table.
This is also very important to realize when in a losing position (called 'time-stop')
If one is in a losing position and prices do not return back to the entry price within 3 to 4 bars, it is almost always a good decision to close the position with a small loss, rather than waiting - and hoping - that prices will turn back into the trade-direction.
Traders who are not aware of this often create these massive 'draw-downs', and sometimes are lucky enough, not to get a margin call.
This is the simple concept to
KEEP YOUR LOSSES SMALL AND LET YOUR PROFITS RUN!
Thank you for showing us examples. Now all you have to do is be the example and upload one of your accounts which reveals that you are doing what you have just mentioned.
May 01, 2015 at 09:26
On yesterday session EURUSD initially fell but found enough buying pressure at 1.1097 to turn around and closed near the high of the day, close to a daily resistance at 1.1232. A break to the upside of the daily resistance at 1.1232 would suggest another push higher to the next daily resistance at 1.1459. Today in most countries is Bank holiday due to the Labor Day so we may expect light trading volumes.
"I trade to make money not to be right."
Jul 10, 2014 부터 멤버
게시물1117
May 01, 2015 at 13:31
honeill posted:
On yesterday session EURUSD initially fell but found enough buying pressure at 1.1097 to turn around and closed near the high of the day, close to a daily resistance at 1.1232. A break to the upside of the daily resistance at 1.1232 would suggest another push higher to the next daily resistance at 1.1459. Today in most countries is Bank holiday due to the Labor Day so we may expect light trading volumes.
EUR/USD did break above 1.1232 and I too think that the pair will continue climbing at least until it reaches 1.1459, although I would not be surprised if it continues moving to the upside until it reaches 1.1700.

Sep 06, 2013 부터 멤버
게시물137
May 01, 2015 at 14:20
hey guys - don't forget its a European bank holiday on Monday!
Have a lovely weekend all!
Have a lovely weekend all!
HOLY GRAIL: Fundamental Analysis to chose your pairs/direction, Technical Entry/SL/TP for consistent Management of those decisions
Nov 21, 2011 부터 멤버
게시물1718
May 01, 2015 at 14:30
BenNathanFTA posted:
hey guys - don't forget its a European bank holiday on Monday!
Have a lovely weekend all!
Looks like your motto is getting smarter !
Nov 21, 2011 부터 멤버
게시물1718
May 01, 2015 at 14:31
CrazyTrader posted:
Where is GBPUSD thread?
Just in case you're wondering how to make pips on Forex? : )
첨부 파일:
Oct 08, 2011 부터 멤버
게시물137
May 01, 2015 at 14:52
explanation as to how we trade out of a closed trading range
첨부 파일:
"a little bit of knowledge is a dangerous thing"


