


EUR/USD


Jul 10, 2014 부터 멤버
게시물1117
Feb 22, 2017 at 15:32
csc2009 posted:
The pair is accelerating its decline, broke below 1.0520 level, testing 1.050/049 zone, next target would be around 1.0450 level.
I agree, it will likely reach 1.0450 - 1.0440. It might even continue moving to the downside towards the previous low at 1.0340.

Sep 12, 2015 부터 멤버
게시물1948
Feb 22, 2017 at 15:37
Just did a buy off the bottom eur/usd , I have a position on eur/gbp also.
"They mistook leverage with genius".
Sep 12, 2015 부터 멤버
게시물1948
Feb 22, 2017 at 15:40
wow what a bullish move.
"They mistook leverage with genius".
Feb 22, 2017 at 16:11
EUR/USD is trading below support in the preopening hours of the European session. The pair is now 1.0522 as it went below the support at 1.0540 yesterday. Euro bulls now have the task to bring the price up from current level which also happens to be a non-validated double bottom on the short-term. If they succeed, then price should be back in the uptrend channel sooner than later.
On the other hand, market participants are taking into consideration the upcoming FOMC minutes later today and that could have a drastic impact on the market, more specifically, the EUR/USD pair.
Until then, market could continue to gravitate towards current levels. Major support rests at 1.0440, while major resistance is located at 1.0720.

Feb 22, 2015 부터 멤버
게시물178
Feb 22, 2017 at 16:11
(편집됨 Feb 22, 2017 at 16:12)
Do you think that Bullish move on EUR/USD was a fake breakout to the upside?
I trade Forex using my Bollinger Trend PRO mt4 indicator.
Sep 12, 2015 부터 멤버
게시물1948
Feb 22, 2017 at 16:19
350 points isn't a fake breakout its usually much less
"They mistook leverage with genius".
Feb 22, 2015 부터 멤버
게시물178
Feb 22, 2017 at 16:21
Yes, I think it was a real breakout. The Bears ran out of money to continue their short sell of EUR/USD. Price went up :)
I trade Forex using my Bollinger Trend PRO mt4 indicator.
Sep 12, 2015 부터 멤버
게시물1948
Feb 22, 2017 at 16:28
FOMC meeting later , I will close before, that might be pushing it higher too , Id say a possible sell off just before the meeting.
"They mistook leverage with genius".
Sep 12, 2015 부터 멤버
게시물1948
Feb 22, 2017 at 18:02
I went short at 5500 after closing my Long position from earlier nice profit, small risk on this short trade so no high blood pressure.
"They mistook leverage with genius".
Feb 22, 2015 부터 멤버
게시물178
Feb 22, 2017 at 18:26
(편집됨 Feb 22, 2017 at 18:41)
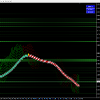
My Bollinger Trend PRO indicator is still glowing red. So, I've decided to place a sell order at 1.05403
I'll start buying again when both the Bollinger band is green and the moving average line starts glowing green.
Right now, it looks like it wants to change direction and move up, up, and up! I need confirmation before I can start to buy.
I'll start buying again when both the Bollinger band is green and the moving average line starts glowing green.
Right now, it looks like it wants to change direction and move up, up, and up! I need confirmation before I can start to buy.
첨부 파일:
I trade Forex using my Bollinger Trend PRO mt4 indicator.

Feb 23, 2017 at 07:09
EUR/USD bounced off the lows yesterday, following the release of FOMC minutes. In the early session today the pair marked a daily high at 1.0572. Minor resistance is seen at 1.0585 and a key one remains the psychological level at 1.0600. The intraday support is located at 1.0500 and lower at 1.0493 (yesterday’s low).

Feb 23, 2017 at 09:11
On yesterday session, the EURUSD initially fell with a narrow range but found enough buying pressure to trim all its losses and managed to close in the green, near the high of the day, in addition closed within Tuesday’s range, which suggests being slightly on the bullish side of neutral.
The currency pair continues to trade below the 10, 50 and 200-day moving averages all should act as dynamic resistances.
The key levels to watch are: a daily resistance at 1.0900, other daily resistance at 1.0819, the 50-day moving average at 1.0626 (resistance), a daily resistance at 1.0622, the 10-day moving average at 1.0600 (resistance) and a daily support at 1.0462.
"I trade to make money not to be right."
Jul 10, 2014 부터 멤버
게시물1117
Feb 23, 2017 at 13:41
The fundamentals yesterday pushed the pair to the upside and it bounced off from the support at 1.0500. If there is a breakout above 1.0570 the retracement could continue towards 1.0620, which is the (MA)89 indicator on the four-hour time-frame.

forex_trader_238875
Mar 26, 2015 부터 멤버
게시물31
Feb 23, 2017 at 16:11
Important level 1.06200
Feb 22, 2015 부터 멤버
게시물178
Feb 23, 2017 at 16:22
(편집됨 Feb 23, 2017 at 16:27)
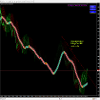
EUR/USD price just broke out of resistance trend line. I'm expecting price to retest that line within the next few days.
첨부 파일:
I trade Forex using my Bollinger Trend PRO mt4 indicator.
Feb 24, 2017 at 06:48
The EUR/USD pair recovered from Tuesday’s lows but yet is unbale to conquer key levels. In the 4 hour chart tehcnical indicators show limited bullish pressure. The price is lightly above the bearish 20-day SMA, while RSI and momentum are aroud their mid-lines, but has lost upward strength.


