Advertisement
Edit Your Comment
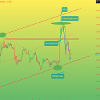
Gold Analysis Update: Stay Ahead of the Trends!
Jan 25, 2022 zamanından beri üye
89 iletiler
Mar 22, 2024 at 10:17
Jan 25, 2022 zamanından beri üye
89 iletiler
Hey everyone,
I wanted to give you a quick update on the latest movement in the gold market, especially for those who caught yesterday's analysis. It seems like our predictions were right on the money, quite literally! 📈
Gold Technical Analysis: Taking a look at the daily chart, gold hit a new all-time high of $2222.70 per ounce yesterday before retracing back, forming a significant upper shadow in the daily candle. This indicates a potential top and hints at a downward movement in the near future.
Moving to the four-hour chart, we observed a sharp increase in gold prices early Thursday morning, spurred by interest rate decisions and Powell's speech. However, the gains were short-lived as gold retraced later in the day. Currently, indicators like the upper Bollinger Band turning downwards, the bearish crossover in the KDJ indicator, and decreasing red bars in the MACD histogram suggest a bearish bias in the overall trend.
If you're looking to stay ahead of the curve and make informed trading decisions, consider following me. We provide real-time updates and analysis to help you navigate the markets effectively.
👍 Like and comment below if you found this update helpful or if you have any insights to share! Let's keep the discussion going. 🚀

*Ticari kullanım ve istenmeyen e-postalara müsamaha gösterilmez ve hesabın feshedilmesine neden olabilir.
İpucu: Bir resim/youtube urlsi yayınlamak, onu otomatik olarak gönderinize gömer!
İpucu: Bu tartışmaya katılan bir kullanıcı adını otomatik olarak tamamlamak için @ işaretini yazın.