


Advertisement
Crude
Jul 09, 2017 at 07:33
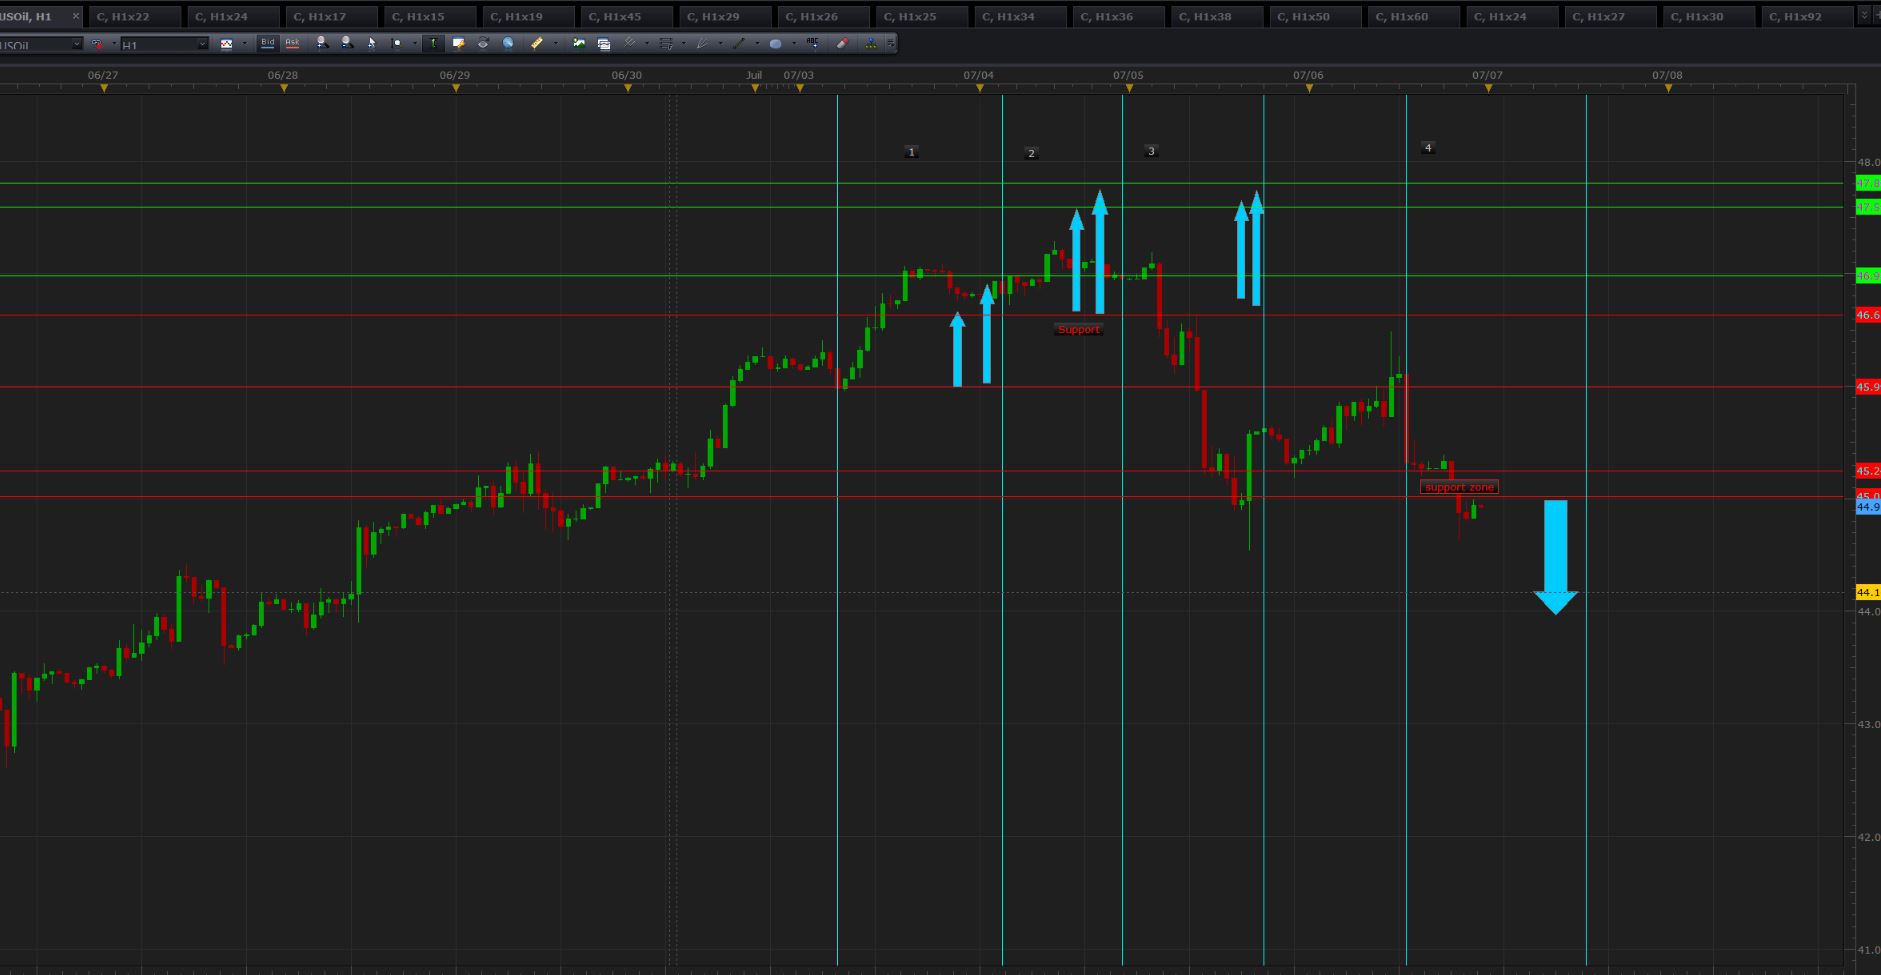
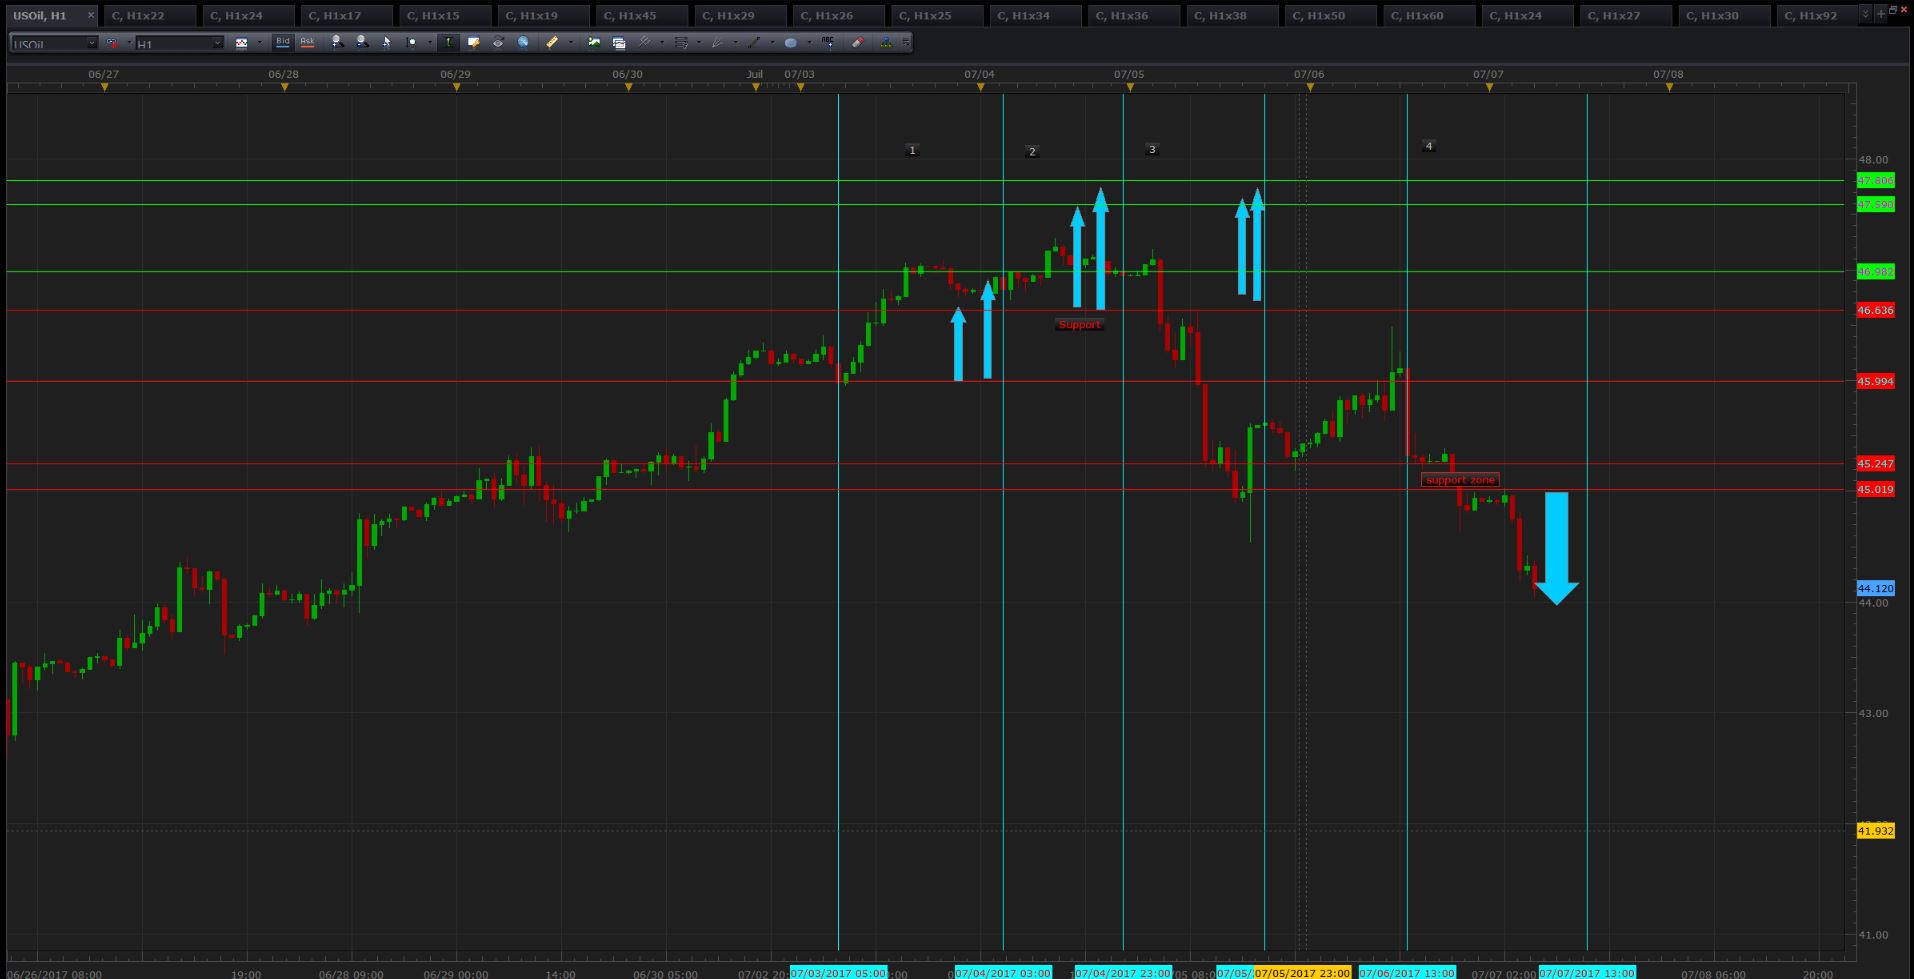
For today
Archivos adjuntos:


May 14, 2018 at 06:47
Intraday Elliottwave Analysis: Oil, a potential rising wedge formation?
Short term we see a potential rising wedge formation.
Once downside resolved, some deeper correction could not be ruled out.
If not, the trend may directly surge higher.
It's too early to build short positions against major trend until we see a clear reversal sign.
If today no touch 71.02 and close below 70, I highly suspect a small top may already formed.
However, above 60.32, there's no major resistance until 74.95, 79.93.
Daily support Levels: 70.38 70.01 69.92 69.78 69.48 69.34
Daily resistance Levels: 70.96 71.02 71.15 71.48 71.51
Intraday Trade Idea:
Sell Latentinterest Order: 71.32
Buy Latentinterest Order: 69.34
http://forexsignal.love/aggressive-trend-scalper-ea/ 5 days' trial period is available. Welcome to backtesting!

forex_trader_528040
Miembro desde Jun 05, 2018
posts 14
Jun 06, 2018 at 08:39
I am bullish on Crude.

Miembro desde Oct 11, 2013
posts 769
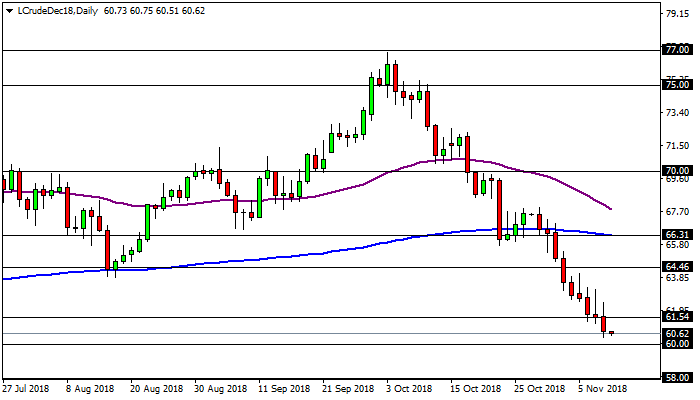
Nov 09, 2018 at 03:44
The price of WTI oil continues falling and completes nine consecutive sessions to the downside. The price of WTI oil breaks below the 200 week EMA at the 61.54 level and it is getting closer to the 60.00 level where it may find some support. But the bearish trend is still in place and the price may fall to the 58.00 level. On the other hand, the price is clearly overextended to the downside and prone to a correction. In case of a pullback, the 61.54 level where we can find the 200 week EMA, could act as resistance, followed by the 55 week EMA at the 64.46 level. The 55 day EMA has changed its direction to the downside and that is an indication of a trend reversal on the daily chart.
Archivos adjuntos:
Miembro desde Oct 11, 2013
posts 769
Nov 17, 2018 at 05:02
WTI oil continued dropping towards the 56.00 zone where it finds a good support, but consolidates around that level. The price is actually stuck between the 56.00 and the 58.00, but the bearish trend is still in place and it could go back down. Below the 56.00 level, the price of WTI oil has the road clear to the 49.00 level. Above the 58.00 level, its next resistance is still the 200 week EMA around the 61.35 level.
Miembro desde Oct 11, 2013
posts 769
Feb 14, 2019 at 04:08
WTI oil has been consolidating for the past 25 sessions around the 53,00 level and the 55 day EMA. From the current levels, the price may head in any direction.
Miembro desde Feb 21, 2019
posts 10
Feb 21, 2019 at 15:21
Maybe turning now. move up is losing momentun. Still a bit early to enter short for me. Crude has a habbit of going up and up
Miembro desde Oct 11, 2013
posts 769
Feb 22, 2019 at 00:40
WTI oil has found a good resistance around the 57.00 level from where it may bounce to the downside, maybe towards the 53.00 level. To the upside, oil may find some resistance around the 60.10 level where we can find the 200 day and 200 week EMAs.
Miembro desde Oct 11, 2013
posts 769
Mar 13, 2019 at 15:39
WTI oil makes a new daily high around the 57.90 level, probably trying to reach the moving average confluence zone between the 59.00 level and the 60.00 level. In that area we can find the 200 day exponential moving average along with the 55 week and 200 week.

Miembro desde Oct 01, 2015
posts 69
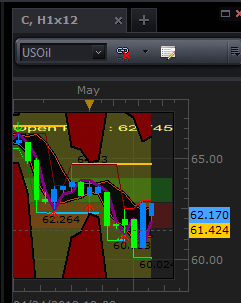
May 02, 2019 at 07:35
anticipated for today
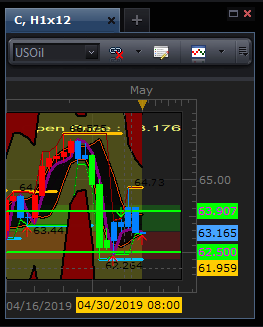
Result

Result
Archivos adjuntos:
forex_trader_718045
Miembro desde May 01, 2019
posts 17
May 05, 2019 at 08:38
Looking for lower oil prices from May 6 to May 8 based on my cycle analysis.
Miembro desde Oct 01, 2015
posts 69
May 06, 2019 at 13:50
Our analysis for today. Click on my name to know where you can get these levels everyday Or So.
Archivos adjuntos:
Miembro desde Oct 01, 2015
posts 69
May 07, 2019 at 07:49
Today 61.10 or 63.35 around will be reached, what is your choice ?
Miembro desde Oct 01, 2015
posts 69
May 07, 2019 at 07:49
Archivos adjuntos:
Miembro desde Oct 01, 2015
posts 69
May 08, 2019 at 05:21
Down was
Archivos adjuntos:
Miembro desde Oct 01, 2015
posts 69
May 16, 2019 at 06:30
Archivos adjuntos:

Miembro desde Oct 01, 2015
posts 69
Feb 24, 2020 at 10:25
https://www.myfxbook.com/files/Crudeoiltrader1/5154E11EE29C48B5B2F5A059EF100640.jpeg
Setup
Archivos adjuntos:


*El uso comercial y el spam no serán tolerados y pueden resultar en el cierre de la cuenta.
Consejo: Al publicar una imagen o una URL de YouTube, ésta se integrará automáticamente en su mensaje!
Consejo: Escriba el signo @ para completar automáticamente un nombre de usuario que participa en esta discusión.


