


Advertisement
GBP/USD daily outlook


Miembro desde Jul 10, 2014
posts 1114
Jan 20, 2017 at 13:05
GBP/USD is testing the support at 1.2250 yet again. A breakout below that support will likely lead to a further drop towards 1.2100.

Jan 21, 2017 at 04:08
holdend posted:
Good point, 1.2250 is certainly the level we should watch for! I expect a consolidation though over the next 24 hours. 1.2370 is the main resistance level in the range.
Consolidation continues, next strong resistance level around 1.2415/2420 zone.

Miembro desde Oct 02, 2014
posts 905
Jan 21, 2017 at 10:02
The Pound had a very good week up against all peers on May's optimism!
Positivity
Miembro desde Jul 10, 2014
posts 1114
Jan 23, 2017 at 14:07
That it did, and it's still very bullish. Next target is likely the resistance at 1.2530, which is the (MA)89 indicator on the daily time-frame.
Jan 24, 2017 at 00:01
victoriajensen posted:
That it did, and it's still very bullish. Next target is likely the resistance at 1.2530, which is the (MA)89 indicator on the daily time-frame.
Market fear the uncertainty of Trump's policies, Pound is going up against dollar, immediate resistance level can be found at 1.2547 level.
Jan 24, 2017 at 07:23
The decline of the dollar supported the pound sterling, which reached a peak of six weeks, while investors predicted that the British High Court later on Tuesday will make a decision about that to start formal negotiations on the withdrawal from the European Union the government needs the approval of Parliament.
The pound reached a high of $1.2538 - the maximum against the dollar since December 15, but then fell slightly to $1.2505.
The pound reached a high of $1.2538 - the maximum against the dollar since December 15, but then fell slightly to $1.2505.
Jan 24, 2017 at 17:45
The pound recorded significant increase against the dollar on Monday. The session started at 1.2375 and ended at 1.2533. After steady upward movement the price managed to break the first resistance at 1.2516. If the upward trend continues we can expect a test of the next resistance at 1.2700.
Jan 24, 2017 at 19:49
The dollar was trading close to a 7-week low against a basket of other major currencies amid lingering market concerns about the protectionist policies of Donald Trump. The weakness of the dollar reflects concerns about the uncertain economic Trump policy, as well as fears that his protectionist stance can reduce corporate earnings and become a brake on economic growth.
On Monday, Trump has initiated a formal process of US withdrawal from participation in the Trans-Pacific Partnership (TPP). It separates the United States from its Asian allies.
Trump also announced his intention to renegotiate the North American Free Trade Area (NAFTA) with Canada and Mexico to the conditions more favorable for the United States.
The pound fell slightly against the dollar. The pair GBP/USD slipped by 0.34% to 1.2488.
Jan 25, 2017 at 01:32
(editado Jan 25, 2017 at 01:33)
Pound's upward trend has suffered shortly, the pair is consolidating after UK Government lost Supreme Court case over Article 50. Next resistance level can be found around 1.2550, break above upward trend might extend further.
Miembro desde Jul 10, 2014
posts 1114
Jan 25, 2017 at 13:26
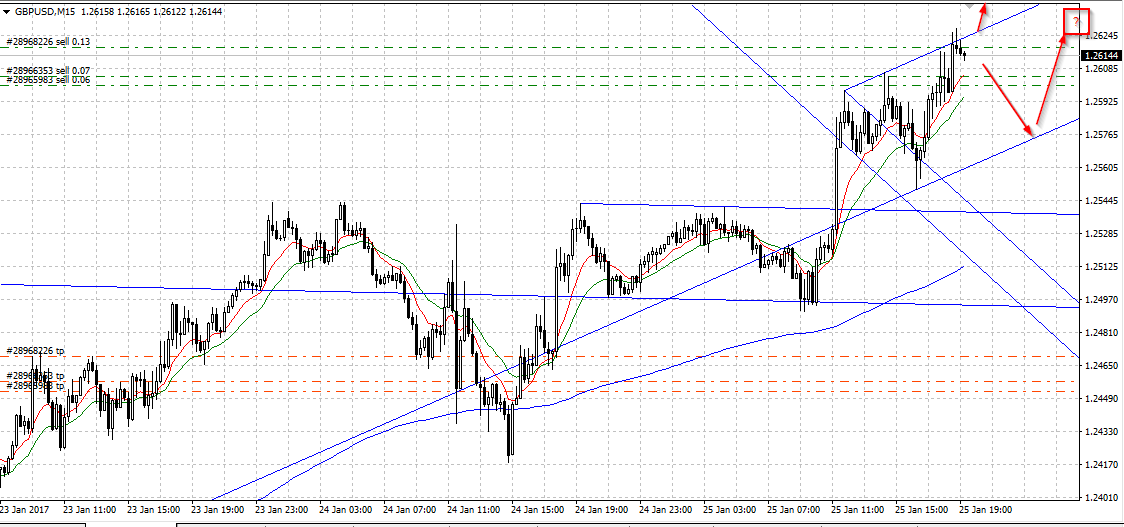
GBP/USD finally broke above the (MA)89 indicator on the daily time-frame despite the hanging man candlestick it had formed below it on the same time-frame. The move to the upside continues, next target is likely 1.2600 - 1.2620.

Miembro desde Oct 08, 2011
posts 135
Jan 25, 2017 at 16:33
On January 19th I posted a major BUY entry signal off the daily chart
with 2 possible entry prices and 3 suggested exits:
(1.2345 + spread + 1 pip)
(1.2417 + spread + 1 pip)
exit 1: near 1.2550
exit 2: near 1.2650
exit 3: near 1.3060
Exit 1 has been reached and prices are headed toward exit 2.
When trading major entry signals on long-term charts like the daily or weekly, it is important not to look at short-term intraday charts, as the temporary counter-trend can be very distracting and often causes a trader to exit much too soon.
Instead, it is better to look at one time frame slower than the one that is traded. In this case it is the weekly chart.
The weekly chart is in congestion with the current bar being nr. 17. which is the first bar to trade out of congestion (congestion = bar 11 through bar 21) in any time frame.
There is a gap open at the high of the measuring bar @ 1.2945
A measuring bar (MB) is a bar, where all following bars have either the open or close price (or both) within the confines of the high and low of it.
In this case, the MB is the bar from October 2nd of last year, counting 17 bars back, starting with the current bar of this week.
Historically, major entry signals on long-term charts have a 90% success rate, and therefore a higher risk can be taken.
"a little bit of knowledge is a dangerous thing"


Miembro desde Oct 11, 2013
posts 769
Jan 25, 2017 at 20:36
The GBPUSD breaks above the 1.2600 level, but it may try to pullback a little bit before continuing higher, maybe tyring to visit the 1.2800 level.


