Advertisement
Supply&Demand Price Action By The5ers Prop trading Fund

Apr 22, 2019 at 07:47
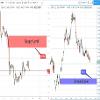
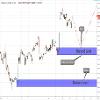
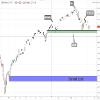
On the 1D chart, we can see the price breakout the demand from the left, on the same chart we can see below the next fresh demand, most likely, the price on his way to reach this Demand below and maybe also the one at the bottom, on the 1Hour chart we can see the next fresh supply levels which are great levels to sell GOLD and join this bearish momentum. I’ll sell at the supply above and if the price will breakout this supply I’ll sell again at the top supply, The first target is the demand below and the final target is the demand at the bottom,
Archivos adjuntos:
We fund the top 5% forex traders
Apr 25, 2019 at 10:42
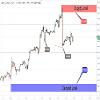
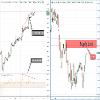
As we heard 2 days ago, president Donald Trump announced about new sanctions on Iran, that cause the USOIL price to jump away and creates new fresh demand, we can see this New demand in the 1Hour chart, that demand below seems like a great continuation level and I’ll buy there if the price retrace the demand, on the 1D chart we can see that the USOIL Price is bullish and probably will stay bullish until reaching the supply above, that supply will be the target for the buy position and also it’s a great level for sell position for the long Terms.
Archivos adjuntos:
We fund the top 5% forex traders
Apr 26, 2019 at 12:26
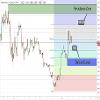
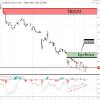
For all time frames, GBPUSD is bearish at the moment and seems it’s gonna stay bearish until the price will reach the demand below that marked in 4H chart, that demand is a great Level for buy position, it’s a potential level for reversal position, the supply above that marked in 1H chart is what called RDB (Rally Base Drop ), the base has a nice rally to that level And then create the base which is the supply, and drops after, that creates a very reliable supply level , It’s a great supply for sell position as a continuation of the bearish momentum.
Archivos adjuntos:
We fund the top 5% forex traders
Apr 30, 2019 at 06:06
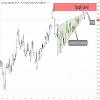
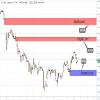
For the long terms, the EURUSD is bearish, The USD get strong against all the other currencies almost, in the 1H chart there is a great supply above, that supply can be a great continuation level For sell position, in the weekly chart I marked the demand at the bottom as the final destination for this bearish momentum, this demand will be the long term target for the sell position, it is Also A great demand for buy position.
Archivos adjuntos:
We fund the top 5% forex traders

May 02, 2019 at 12:56
Yesterday, the EUR/USD was dropped down from about 70 pips in about 10 minutes, This creates a new and fresh supply above, which is also a Quasimodo level pattern – after a few higher -lows, the price creates a new lower-low with one sharp move down. That supply is a great level for sell position and the target will be the demand below which is also a great level for buy position. Both levels are relevant for day trading.

Archivos adjuntos:
We fund the top 5% forex traders
May 05, 2019 at 12:34
Yesterday, the EUR/USD was dropped down from about 70 pips in about 10 minutes, This creates a new and fresh supply above, which is also a Quasimodo level pattern – after a few higher -lows, the price creates a new lower-low with one sharp move down. That supply is a great level for sell position and the target will be the demand below which is also a great level for buy position. Both levels are relevant for day trading.
Archivos adjuntos:
We fund the top 5% forex traders
May 07, 2019 at 10:21
In this 4H chart, we can see that GBPUSD is in bullish momentum, it seems that nothing can stop the price at least until the price will reach the resistance above, we can see that the demand Below is also the 0.50 Fibonacci level of the recent uptrend, the combination of the demand and the 0.50 Fibonacci makes that level a great level for buy position, the resistance above will be the Final target for this buy position, this opportunity relevant for swing forex traders.
Archivos adjuntos:
We fund the top 5% forex traders
May 14, 2019 at 13:48
As we can see on the 1D chart, the USDCAD price is struggling to move up, this kind of price behavior called “Compression“, the price move up step by step in a way that looks powerless, many Small candles, everything seems pressed, above us, there is a great supply which most probably holds many unfilled orders, that indicates a strong level, the combination of a price move up by Compression and a supply level creates a great opportunity for sell position, when the price touch the supply above, it’s the time to sell.
Archivos adjuntos:
We fund the top 5% forex traders
May 15, 2019 at 12:07
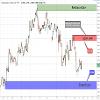
For the long terms, XAUUSD is in bearish momentum, However, below us, there are two great and fresh demand levels with a great potential for buy position, each one of them looks really strong Level, if the price reaches the demand below I’ll buy there, the stop loss order will be just below this demand and if the price will breakout the demand and hit the stop loss we can buy again at the Demand at the bottom, both levels can be also the right levels to take profit for those who holding sell positions,
Archivos adjuntos:
We fund the top 5% forex traders
May 17, 2019 at 08:55
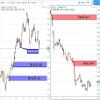
If we look at the 1H chart, we can see the EURGBP is in strong and long bullish momentum, the indication that this bullish momentum is about to end is the combination of the supply above and The CCI indicator divergence, on the 1D chart we can see the price is just about to hit the supply above, this supply seems fresh and it’s the first time the price will touch it, on the 1H chart we can See also a clear divergence between the CCI and the price, while the price creates a higher high, the CCI indicator creates a lower high, the combination of the supply and the divergence creates a Great opportunity for sell position at the supply above.
Archivos adjuntos:
We fund the top 5% forex traders
May 19, 2019 at 05:45
The GBPUSD has made another new supply over, this supply has broken out an interest level from the left (31/12) which make this supply considerably more grounded one. until further notice, I trust the Price will in general achieve the help zone underneath, this continuation supply above is an incredible dimension for sell position for swing forex brokers, I'll sit tight at the cost at this supply to sell, and my Target will be the help beneath, this supply can be likewise applicable for informal investors,
May 19, 2019 at 10:10
The5ers1 posted:kamal888 posted:
Hi, May i know where I can read about this method?
Search for supply and demand education, you can find it on youtube also, try to find Sam Seidan's videos
You can also watch some of our videos about supply and demand
We fund the top 5% forex traders
May 19, 2019 at 13:51
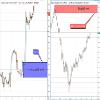
As we can see, the AUDJPY is in bearish momentum, the price went down almost 500 pips in that bearish momentum, also, we can see a clear divergence between MACD and the price, as we Know, that divergence indicates that the price losing power and the bearish momentum is about to end, now, besides the divergence, we waiting for the price to break out the resistance above and To create a new fresh demand, if that happened, it will be a great setup for buy position, the final target will be the supply at the top, which is also a great supply for sell position, that analysis Relevant for swing forex traders,
Archivos adjuntos:
We fund the top 5% forex traders
May 21, 2019 at 05:53
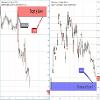
As we can see, the USDJPY has just started to develop a bullish momentum by breakout the last high of the recent bearish momentum, as the price is bullish for now, it will be wiser to look For a reason to buy, the demand below seems like a great level for buy position, on the first touch of the price at that level it’s the right time to buy, the first target will be the supply above, the final Target will be the supply at the top which is also a great level of sell position.
Archivos adjuntos:
We fund the top 5% forex traders
May 26, 2019 at 12:42
In this 4H chart, we can see that the SPX500 is still bullish and the price just arrived into the support zone which is a critical level. If the price breaks out the support, then it will indicate that the Bullish momentum has ended and the price now becomes bearish. That support is also the neckline of the Head & Shoulder pattern. In order to complete the pattern, the price must break the neckline and if that Happens, it will be the first signal to look for a sell position. Now, all we need to do is to look for a price action setup to find the right level to sell. A new supply that will break the neckline will be a great level to sell, but we will have to wait and see if the target for this position will be the demand below.
Archivos adjuntos:
We fund the top 5% forex traders
May 28, 2019 at 06:18
kamal888 posted:
Hi, May i know where I can read about this method?
but problem with this kind of techniques , u must have to be very hard worker , and consistent and keen for this method
becoz this can snatch piece of beak by your mouth , demand supply , elliot wave , price action VSA , these kind of methods can easily take around 2 years to be expert of these methods :) i am saying it becoz i am expert of all these :)
*demand supply ( u should face small small Stoplosses in range market , and then big profit which will cover every thing )
*elliot wave ( u should have to be so much patience untill market doesnt come back in trend or u may can face big loss too , becoz if H1 cycle failed then wait with H4 cycle and then daily etc )
* price action ( including TL , Fib , CSP , CP, SR etc many time fails and many time pass )
* VSA ( u need to watch many brokers otherwise 1 broker volume can cheat u , )
**** these were key points of these stratgies which u may learn after spending years :)
**** one common thing u must have alot of patience to enter at accurate entry and exit , 2nd u have to do alot of hard work like need to watch economy calendar carefull , *** and last important think u must need to be a very hard worker boy , bcoz these techniques take so much hard work and time , like u should analysis monthly , weekly , daily , H4 TF , and then u can enter in H1 with good entry
skype id millennium.analyst