


Advertisement
counting max achievable profit
Oct 01, 2014 at 06:34
855 व्यू
5 Replies

तबसे मेंबर है Sep 10, 2009
145 पोस्टों
Oct 01, 2014 at 06:34
Hi guys, I´m building one EA based on MA crosses. This EA uses trailing stops. I want to find out values that would cause profit in majority of cases. I was wondering if we can calculate somehow "max achievable profit" If I open a trade just after 2 MA crosses, what is the max profit I can reach. I would need these values, their average value, modus and median. It can be displayed in chart or in xls file.
Any ideas? thanks
Any ideas? thanks
अटैचमेंट :

तबसे मेंबर है Apr 20, 2010
808 पोस्टों
Oct 01, 2014 at 22:46
(एडिट हो रहा है Oct 01, 2014 at 22:46)
Nope have formula, you just need create your own formula.
My formula at this moment :
Open 3 Trade upon Cross 2MA.
Get the Highest ATR (7period) of last 21 Bars.
If AccProfit >10, trigger the following Trailing Stop :
1 Order) Trailing Stop1 = ATR x1.0 + TrailingStep : 0
2 Order) Trailing Stop1 = ATR x1.7 + TrailingStep : 10 pips
3 Order) Trailing Stop1 = ATR x2.3 + TrailingStep : ATR
Auto Refill back TrailingStop if the TrailingStep counter is Over.
Information is Gold when come to organised.
तबसे मेंबर है Sep 10, 2009
145 पोस्टों
Oct 02, 2014 at 06:13
(एडिट हो रहा है Oct 02, 2014 at 06:18)
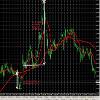
Okay, see my picture. I added ATR (7) to the chart. Its high of last 21 bars = 0.0021
When 2 MA crosses, I open 3 trades:
1st trade) trailing stop1 = 0.0021 x 1.0 + 0 = 0.0021
2nd trade) trailing stop2 = 0.0021x1.7 + 10 = 10,00357
3rd trade) trailing stop3= 0.0021x2.3 + 0.0021 = = 0.00693
?
or you mean
1st trade 21+0 = 21 pips
2nd trade 35,7 + 10= 45,7 pips
3rd trade 48,3 + 21 = 69,3 pips
?
अटैचमेंट :
तबसे मेंबर है Apr 20, 2010
808 पोस्टों
Oct 03, 2014 at 01:06
TrailingStep actually mean StepDown.
1st trade 21+0 = 21 pips ( TS =21) (TStep =0)
2nd trade ( TS =36) (TStep =10)
3rd trade (TS=48) (TStep =21)
Example StepDown 10pips:
Current Bar TS=36, next Bar : TS=26, next Bar : TS=6, next Bar : TS =-4.
if (TS<0 && AccProfit()>0) { TS= Original TS 36 pips again.}
Then TrailingStep repeat again.
You can adjust also evey 1 Bars/ n Bars to do the StepDown process.
Information is Gold when come to organised.
तबसे मेंबर है Sep 10, 2009
145 पोस्टों
Oct 04, 2014 at 17:37
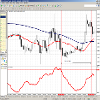
Okay. I did it this way:
Open 3 trades based on MA cross
1st: start trailing after 1xATR
2nd: start trailing after 2.5 ATR
3rd: when 2nd trade is closed, run trailing of 0.5ATR
and this is the result
Open 3 trades based on MA cross
1st: start trailing after 1xATR
2nd: start trailing after 2.5 ATR
3rd: when 2nd trade is closed, run trailing of 0.5ATR
and this is the result
अटैचमेंट :

*व्यवसायिक इस्तेमाल और स्पैम को ब्रदाश नहीं किया जाएगा, और इसका परिणाम खाता को बन्द करना भी हो सकता है.
टिप: किसी चित्र या यूट्यूब या URL को पोस्ट करने से वे अपने आप आपके पोस्ट में आजाएगा!
टिप: @ चिन्ह को टाइप करें उपभोगता के नाम को अपने आप करने के लिए जो इस चर्चा में भाग ले रहा है.


