


Advertisement
Supply&Demand Price Action By The5ers Prop trading Fund

Dec 04, 2019 at 09:16
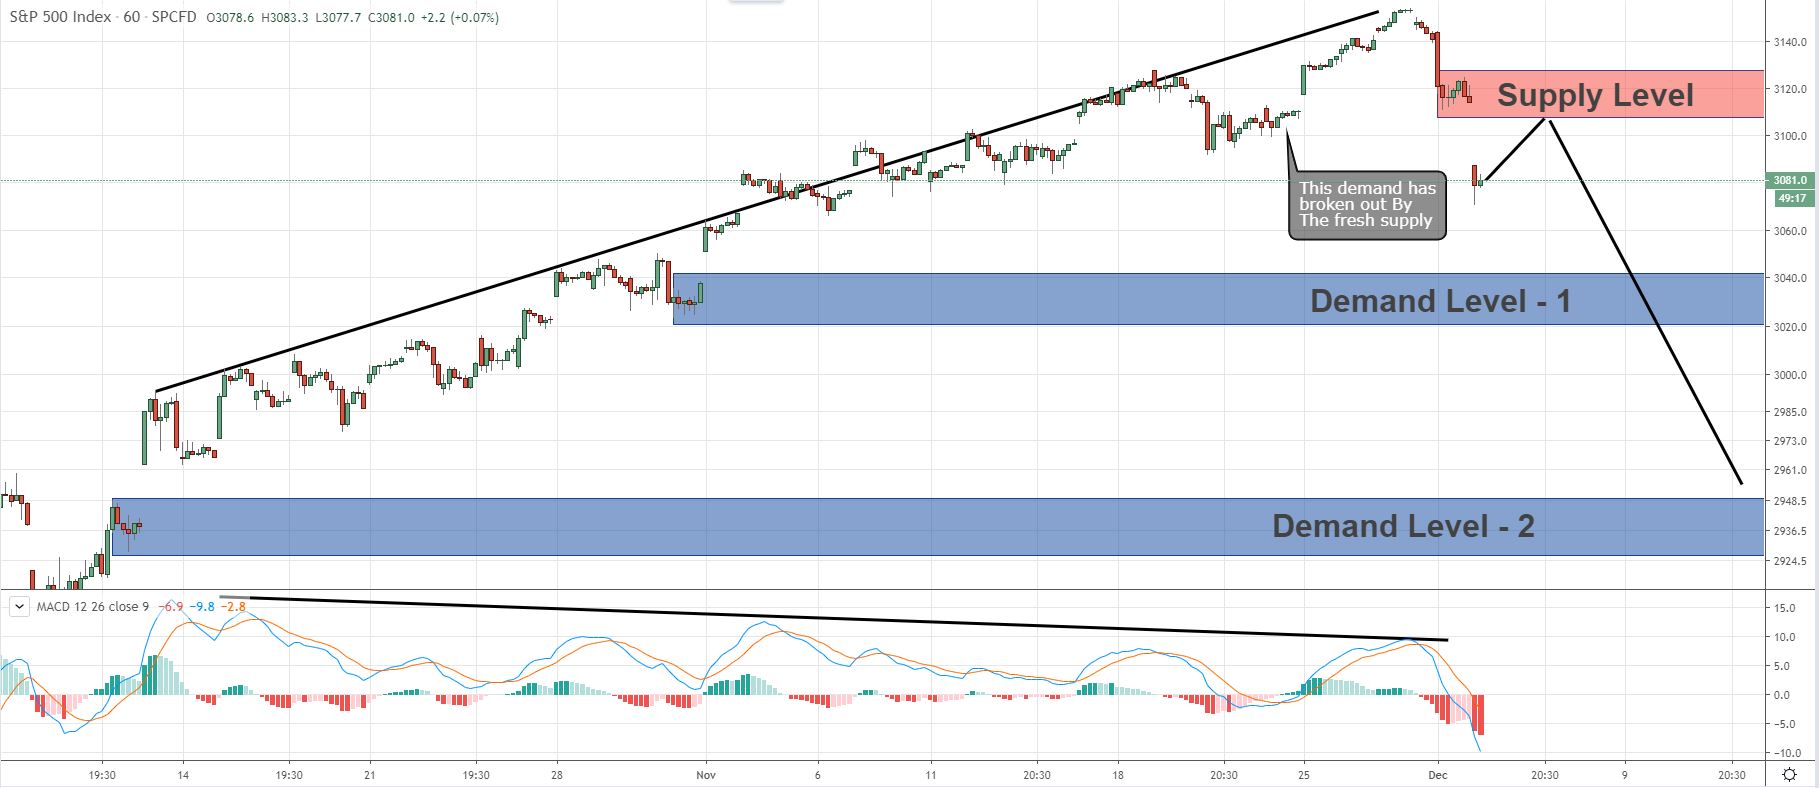
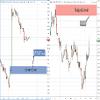
As we can see in the H1 chart, the SPX500 has open the previous trading day with a huge GAP which creates fresh supply,
There is also significant MACD divergence which lasts almost 2 months.
The fresh supply above also change the momentum from bullish to bearish .
I'll sell at the supply above on the first touch.
The first target will be demand - 1, and the final target will be demand - 2.
There is also significant MACD divergence which lasts almost 2 months.
The fresh supply above also change the momentum from bullish to bearish .
I'll sell at the supply above on the first touch.
The first target will be demand - 1, and the final target will be demand - 2.
첨부 파일:
We fund the top 5% forex traders
Dec 04, 2019 at 12:46
The USD/JPY price created a fresh demand below,
This demand also creates a Quasimodo pattern which is a reversal pattern
I'll buy at this demand on the first touch of the price and the target will be the supply above which also a great level for sell position.
Both options are relevant for day trading.
This demand also creates a Quasimodo pattern which is a reversal pattern
I'll buy at this demand on the first touch of the price and the target will be the supply above which also a great level for sell position.
Both options are relevant for day trading.
We fund the top 5% forex traders
Dec 08, 2019 at 13:22
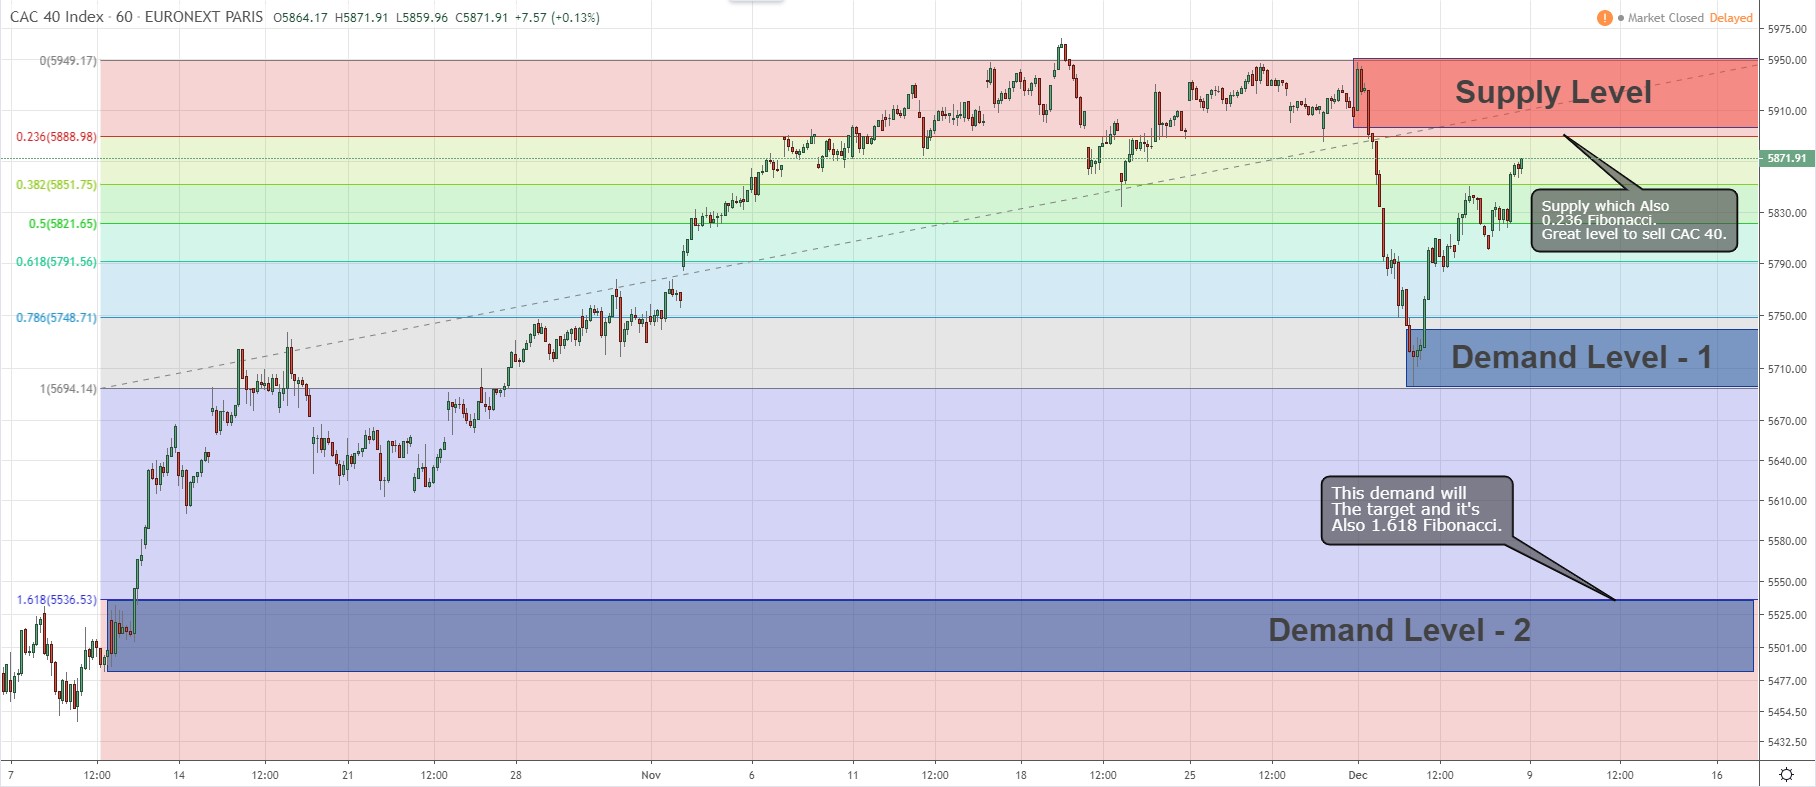
The price creates a fresh supply above which also 0.236 Fibonacci level of the last drop in the price.
It is a great level to sell CAC40 Index on the first touch,
The first target will be demand - 1 and the final target is demand - 2.

It is a great level to sell CAC40 Index on the first touch,
The first target will be demand - 1 and the final target is demand - 2.
첨부 파일:
We fund the top 5% forex traders

forex_trader_745947
Jul 08, 2019 부터 멤버
게시물54
Dec 09, 2019 at 18:15
Look likes rocket science What's the benefit with it ?
Dec 11, 2019 at 11:47
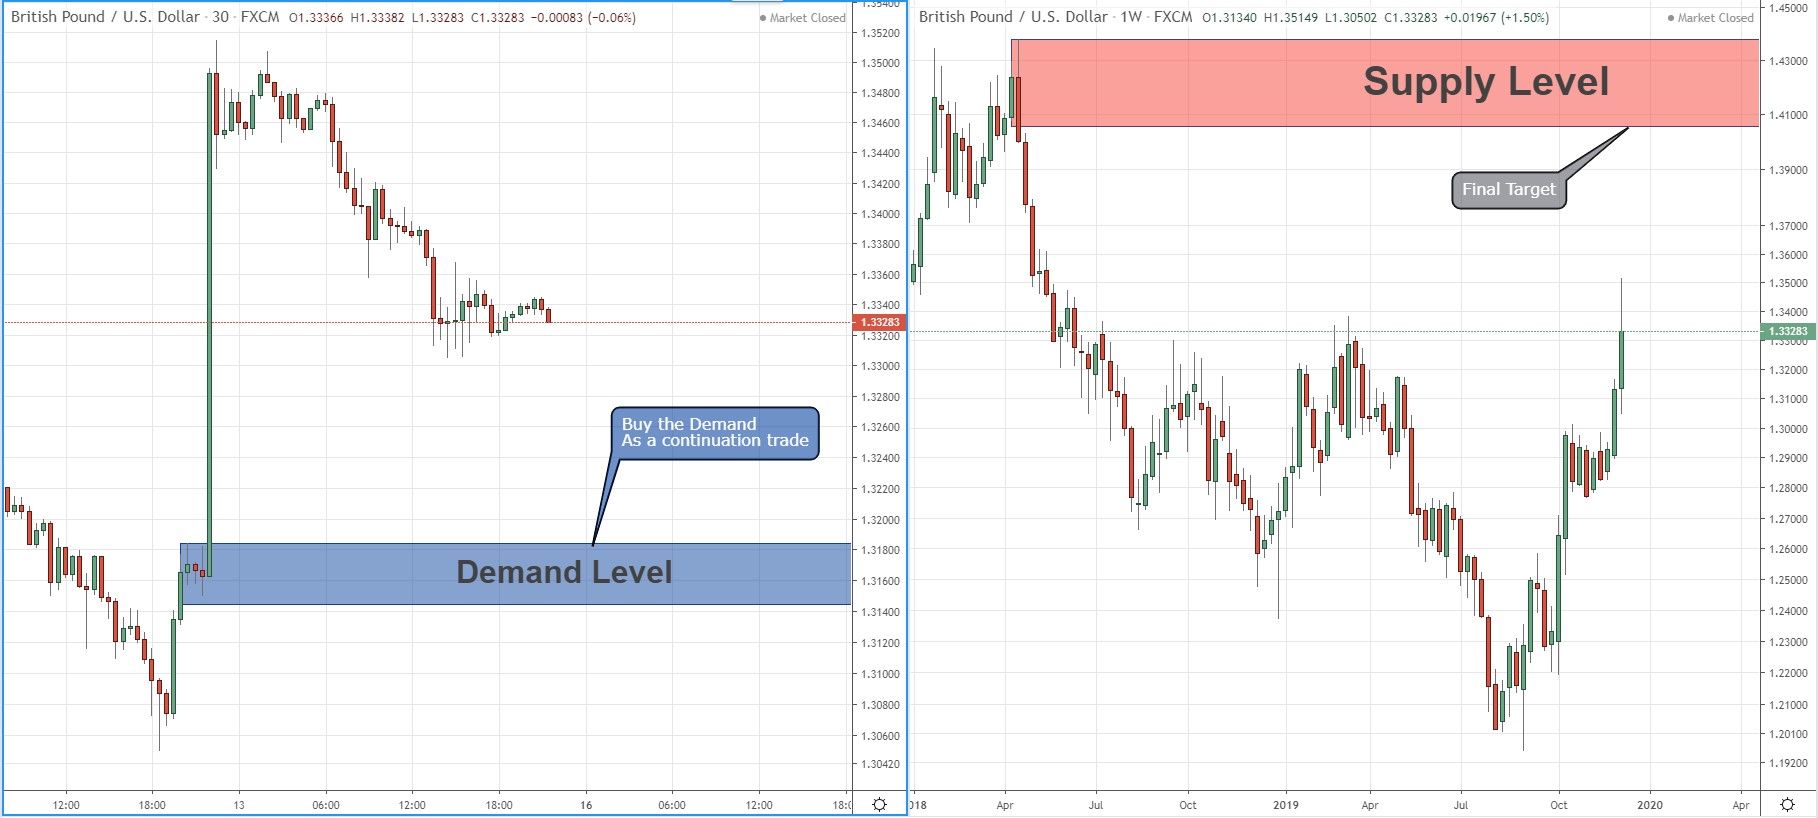
As we can see a few hours ago the GBP/USD price creates new supply.
This supply seems like a great level for sell position.
I'll sell at the supply on the first touch of the price.
The first target will be the demand below and the final target will be the demand at the bottom.
This supply seems like a great level for sell position.
I'll sell at the supply on the first touch of the price.
The first target will be the demand below and the final target will be the demand at the bottom.
We fund the top 5% forex traders
Dec 15, 2019 at 11:04
After the UK election results, the GBP/USD has a nice rally which creates new fresh demand,
This demand is a great level for a continuation buy position.
I'll buy this demand and the final target will be the supply above on the Weekly chart.
This demand is a great level for a continuation buy position.
I'll buy this demand and the final target will be the supply above on the Weekly chart.
첨부 파일:
We fund the top 5% forex traders
Dec 24, 2019 at 10:03
As we can see in the H4 chart, the price creates a fresh demand below which also Quasimodo pattern.
This demand has changed the bearish momentum to bullish momentum,
As it seems now, the price tends to reach the supply - 1 and maybe even the Supply level - 2.
If the price retraces the demand below I'll buy there,
My first target will be supply level - 1 and the final target is supply level - 2.
https://www.tradingview.com/i/qbPrTwiI/
We fund the top 5% forex traders

*상업적 사용 및 스팸은 허용되지 않으며 계정이 해지될 수 있습니다.
팁: 이미지/유튜브 URL을 게시하면 게시물에 자동으로 삽입됩니다!
팁: @기호를 입력하여 이 토론에 참여하는 사용자 이름을 자동으로 완성합니다.


