


Advertisement
Swing Trading Analysis & Results

Nov 19, 2014 부터 멤버
게시물157
Jan 15, 2016 at 08:05
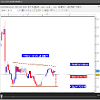
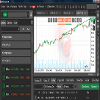
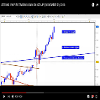
Yesterday`s Video Lesson on the NZD CHF.
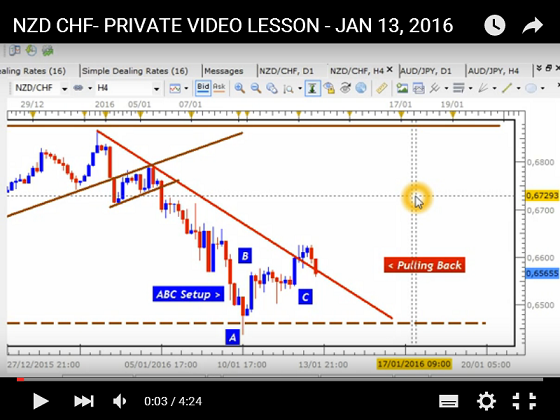
/JAN_3_2015_NZD_CHF_PULLBACK.png" target="_blank" rel="noopener noreferrer nofollow"> /JAN_3_2015_NZD_CHF_PULLBACK.png"/>
Other highlights of yesterday´s analysis
GBP JPY
AUD USD

Duane
DRFXTRADING
/JAN_3_2015_NZD_CHF_PULLBACK.png" target="_blank" rel="noopener noreferrer nofollow">
Other highlights of yesterday´s analysis
GBP JPY
AUD USD
Duane
DRFXTRADING
첨부 파일:
Trade Less, Earn More
Nov 19, 2014 부터 멤버
게시물157
Jan 15, 2016 at 08:06
All three have trading possibilities. However, AUD USD, GBP JPY are the front runners.
Duane
Duane
Trade Less, Earn More

Oct 02, 2014 부터 멤버
게시물905
Jan 21, 2016 at 15:03
thanks for sharing!
Positivity

Nov 19, 2014 부터 멤버
게시물157
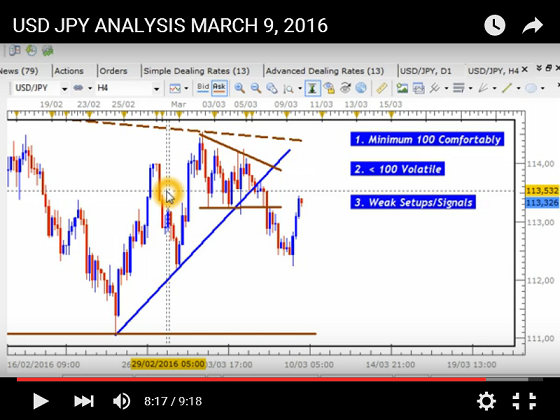
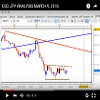
Mar 10, 2016 at 05:08
(편집됨 Mar 10, 2016 at 05:11)
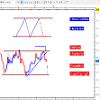
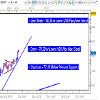
Hey all,
Sharp Reversal USD JPY, would have taken out Stop Loss had I traded it..
It was tempting, but there were some important reasons that led me to avoid this one.
/MARCH_2_2016_USD_JPY_YOUTUBE_DAILY.png" target="_blank" rel="noopener noreferrer nofollow">/MARCH_2_2016_USD_JPY_YOUTUBE_DAILY.png"/>
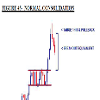
As you can see, the last Bearish Candle was fairly weak compared to those that normally lead to strong moves such as those that led to the strong downtrend on the left hand side of the chart.
Key is to always keep an eye on the Daily Chart despite how strong the signals on the 4 H Chart maybe.

Sharp Reversal USD JPY, would have taken out Stop Loss had I traded it..
It was tempting, but there were some important reasons that led me to avoid this one.
/MARCH_2_2016_USD_JPY_YOUTUBE_DAILY.png" target="_blank" rel="noopener noreferrer nofollow">
As you can see, the last Bearish Candle was fairly weak compared to those that normally lead to strong moves such as those that led to the strong downtrend on the left hand side of the chart.
Key is to always keep an eye on the Daily Chart despite how strong the signals on the 4 H Chart maybe.
첨부 파일:
Trade Less, Earn More
Nov 19, 2014 부터 멤버
게시물157
Mar 10, 2016 at 05:47
(편집됨 Mar 10, 2016 at 05:49)
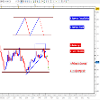
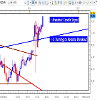
Hey all
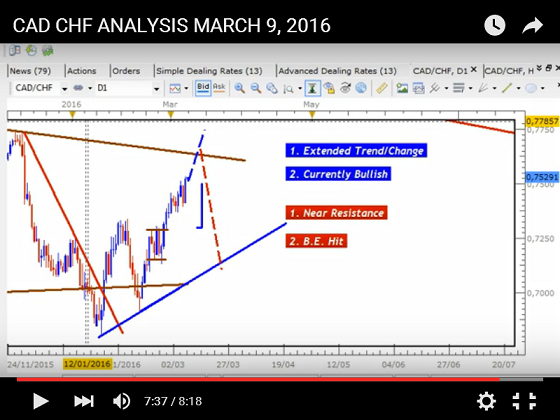
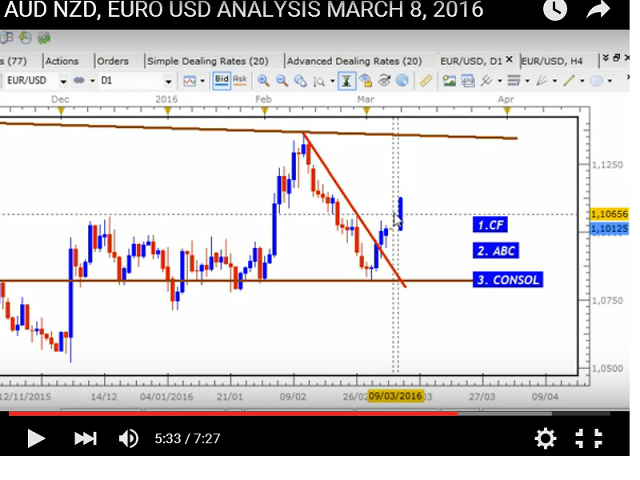
CAD CHF rallying towards the Resistance of its Large Pennant Setup similar to the AUD CHF just traded.
Difference is that CAD CHF is doing so with weaker candles and the Breakout Target for the small Range Setup has been hit.
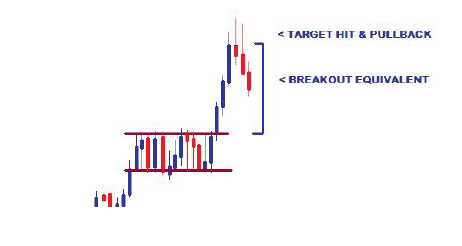
This could see the pair starting to pullback before actually hitting the Resistance.
&feature=youtu.be
On the other hand, the current Uptrend is fairly strong and we have a Bullish Candle that closed yesterday on the Daily Chart. This could take it to the Resistance oon the way to a breakout.
Whatever it does, just have to wait until we see a strong setup and signal to trade, AS LONG AS they meet my/your trading rules.
Duane
DRFXTRADING
CAD CHF rallying towards the Resistance of its Large Pennant Setup similar to the AUD CHF just traded.
Difference is that CAD CHF is doing so with weaker candles and the Breakout Target for the small Range Setup has been hit.
This could see the pair starting to pullback before actually hitting the Resistance.
&feature=youtu.be
On the other hand, the current Uptrend is fairly strong and we have a Bullish Candle that closed yesterday on the Daily Chart. This could take it to the Resistance oon the way to a breakout.
Whatever it does, just have to wait until we see a strong setup and signal to trade, AS LONG AS they meet my/your trading rules.
Duane
DRFXTRADING
첨부 파일:
Trade Less, Earn More
Nov 19, 2014 부터 멤버
게시물157
Mar 14, 2016 at 01:57
This EURO bad boy been in a Pennant for quite awhile..Daily Chart..
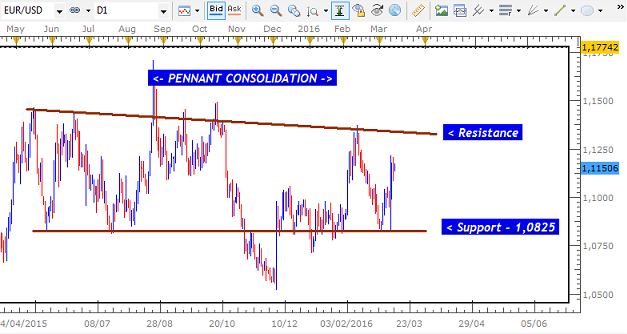
This explains most of the crazy **** moves that been happeniing over the last several months, like that on Thursday.
Even though it was set off by the ECB action, these setups often have these erratic moves as they move from Support to Resistance.
I was actually getting ready to trade this bullish, expecting one of 3 possible Signals...
/FEB_4_2016__EURO_USD_DAILY_149_PIPS_Z0.png" target="_blank" rel="noopener noreferrer nofollow">/FEB_4_2016__EURO_USD_DAILY_149_PIPS_Z0.png"/>
Sometimes these setups can lead to losses with these types of news etc., but sometimes when you catch them at the right time with the right setup..can take our pound of flesh from them
Duane
DRFXTRADING
This explains most of the crazy **** moves that been happeniing over the last several months, like that on Thursday.
Even though it was set off by the ECB action, these setups often have these erratic moves as they move from Support to Resistance.
I was actually getting ready to trade this bullish, expecting one of 3 possible Signals...
/FEB_4_2016__EURO_USD_DAILY_149_PIPS_Z0.png" target="_blank" rel="noopener noreferrer nofollow">
Sometimes these setups can lead to losses with these types of news etc., but sometimes when you catch them at the right time with the right setup..can take our pound of flesh from them
Duane
DRFXTRADING
Trade Less, Earn More
Nov 19, 2014 부터 멤버
게시물157
Apr 06, 2016 at 09:49
Latest trade, 130 Pips GBP USD
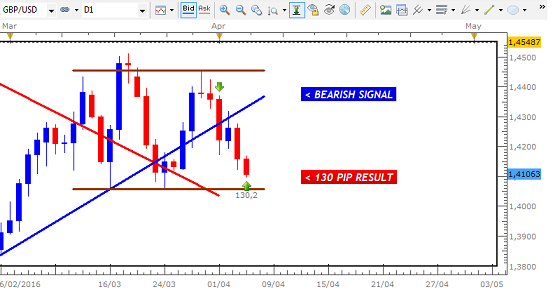
Slow and Steady Wins The Race.
Details Later
Trade Less, Earn More
Mar 13, 2016 부터 멤버
게시물2
Apr 07, 2016 at 06:33
It was very useful info
Nov 19, 2014 부터 멤버
게시물157
Oct 09, 2016 at 07:06
Hey Traders, how goes it?
I firmly believe the Currrency Market WANTS US TO BE PROFITABLE. It WANTS US TO BE ABLE TO PREDICT IT and profit from it unlike the false belief given to us that its impossible to be successful. Take the recent trade on the GBP CAD.
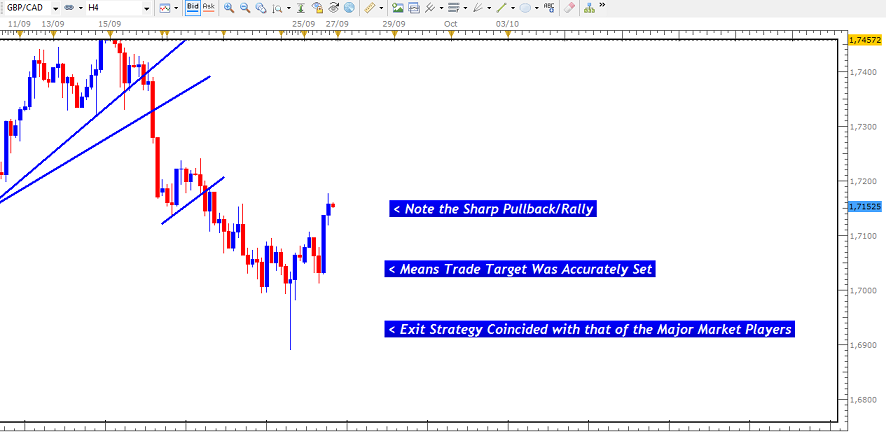
This recent trade on the GBP CAD provided 175 Pips in about 3 days, as the pair continued to form a Range Setup on its Daily Chart.
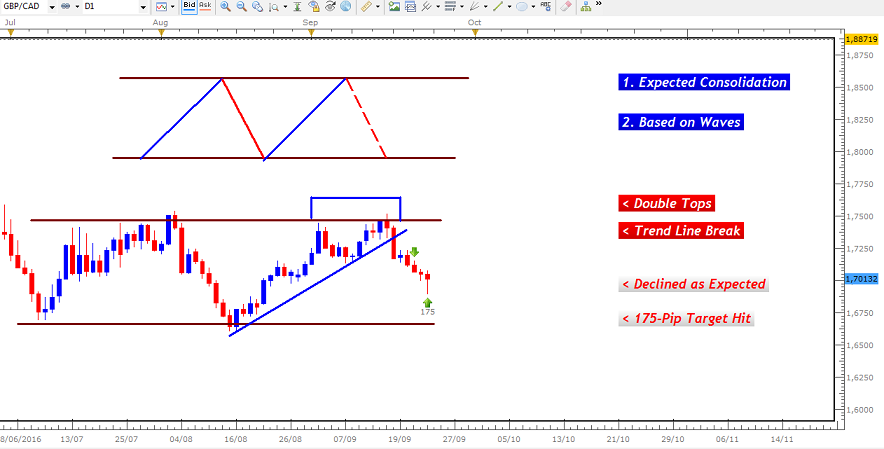
The Signals given that gave the green light that it was good time to enter was the Double Tops and the break of the Uptrend Line on the Daily Chart...
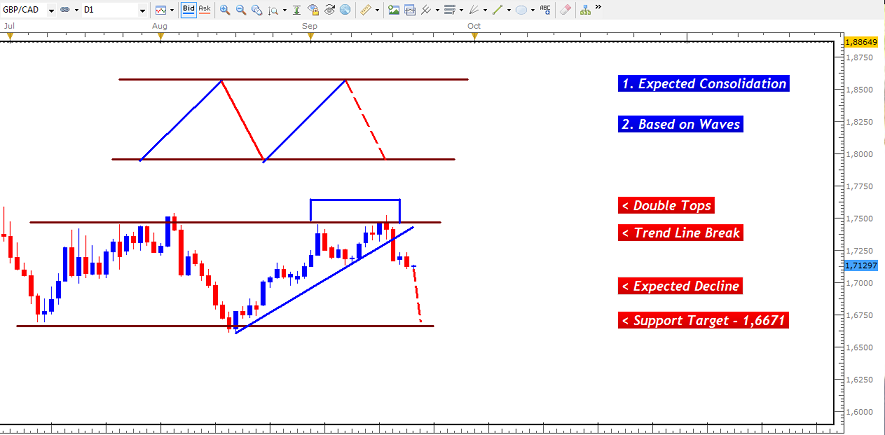
After these were seen, I then used the 4 Hour Chart to enter short...
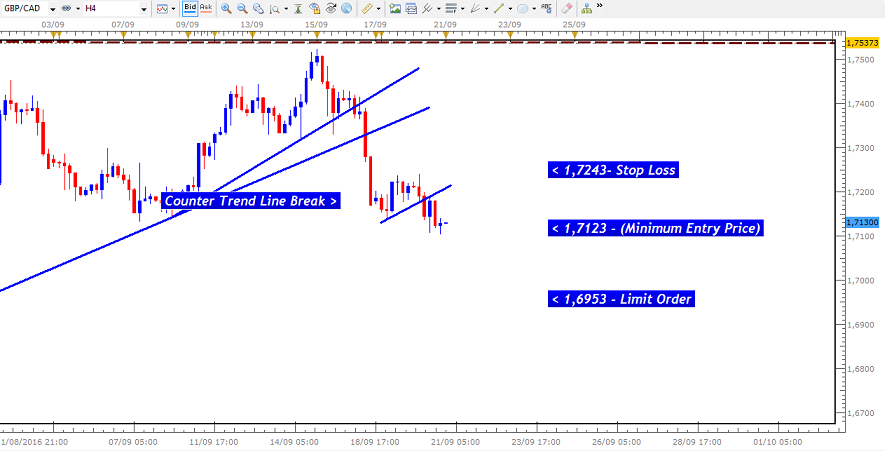
After a few days, target was hit. This was folllowed by a sharp pullback that took place shortly after my exit, indicating that the target was accurately set and that my Exit Strategy was in sync with those of other traders.
As I continue to trade, what I realize is that the Currency Market almost WANTS US TO PREDICT IT and PROFIT FROM IT. (Unlike some of the brokers out there lol) Why do I say this?
One of the main things about this trade was that it took advantage of being able to predict the formation of the Range and the downtrend that was gonna take place.
As you will hear in the video analysis below, there are certain pattens of candles that the market gives that tells us when these patterns are taking place. Once you can spot them and anticipate when U-Turns will take place, you´ll have the ability to exit trends that are about to end and get ready to trade in the opposite direction - for strong gains.
This is how the market works. It has a certain set of Candlestick Patterns that indicate what will take place. These patterns are repeated on a regular basis and happen across all curencies. Its almost as if the market wants to make sure we can see what it will do by repeating these patterns over and over every week until we finally see it, understand it and are able to make a trading plan to profit from them.
So the market is very difficult even to the experienced traders, but it gets easier when we are able to spot these patterns and profit from them with less fear and anxiety but with more Confidence and Certainty.
Duane
I firmly believe the Currrency Market WANTS US TO BE PROFITABLE. It WANTS US TO BE ABLE TO PREDICT IT and profit from it unlike the false belief given to us that its impossible to be successful. Take the recent trade on the GBP CAD.
This recent trade on the GBP CAD provided 175 Pips in about 3 days, as the pair continued to form a Range Setup on its Daily Chart.
The Signals given that gave the green light that it was good time to enter was the Double Tops and the break of the Uptrend Line on the Daily Chart...
After these were seen, I then used the 4 Hour Chart to enter short...
After a few days, target was hit. This was folllowed by a sharp pullback that took place shortly after my exit, indicating that the target was accurately set and that my Exit Strategy was in sync with those of other traders.
As I continue to trade, what I realize is that the Currency Market almost WANTS US TO PREDICT IT and PROFIT FROM IT. (Unlike some of the brokers out there lol) Why do I say this?
One of the main things about this trade was that it took advantage of being able to predict the formation of the Range and the downtrend that was gonna take place.
As you will hear in the video analysis below, there are certain pattens of candles that the market gives that tells us when these patterns are taking place. Once you can spot them and anticipate when U-Turns will take place, you´ll have the ability to exit trends that are about to end and get ready to trade in the opposite direction - for strong gains.
This is how the market works. It has a certain set of Candlestick Patterns that indicate what will take place. These patterns are repeated on a regular basis and happen across all curencies. Its almost as if the market wants to make sure we can see what it will do by repeating these patterns over and over every week until we finally see it, understand it and are able to make a trading plan to profit from them.
So the market is very difficult even to the experienced traders, but it gets easier when we are able to spot these patterns and profit from them with less fear and anxiety but with more Confidence and Certainty.
Duane
첨부 파일:
Trade Less, Earn More
Nov 19, 2014 부터 멤버
게시물157
Oct 09, 2016 at 07:09
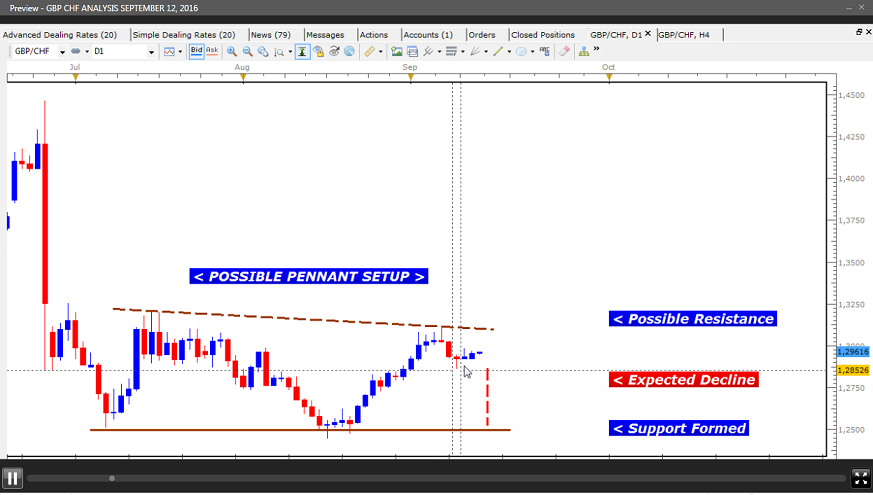
....ignore the GBP CHF graph above...here is the GBP CAD

Sorry about that.
Duane
첨부 파일:
Trade Less, Earn More
Nov 19, 2014 부터 멤버
게시물157
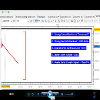
Dec 04, 2016 at 09:56
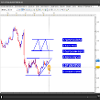
Hey Traders,
Latest trade gave me a great 198 Pip Gain on the NZD JPY over the last few days as you can see on my Live Account below.
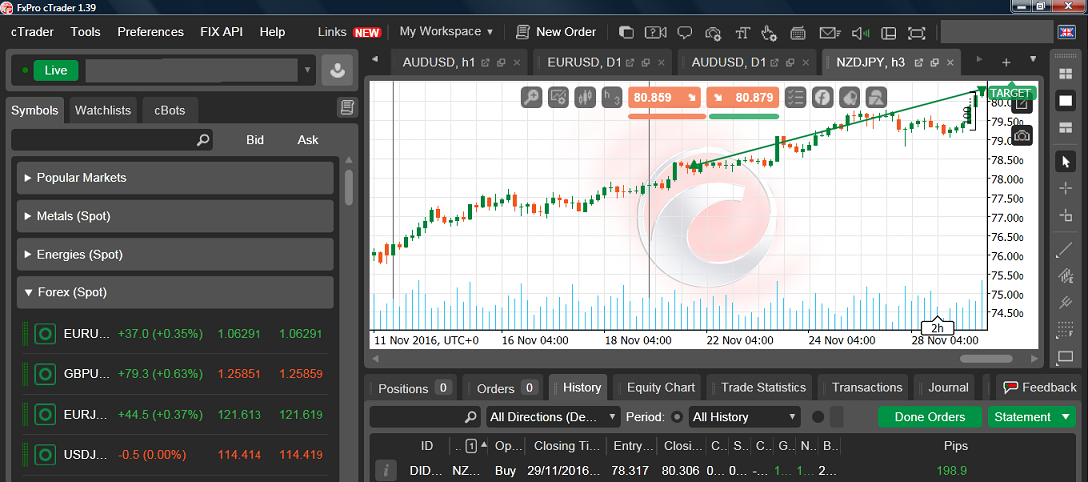
Live Trades- previously done with Dukascopy which cant be linked to Myfxbook - now being done with FXPRO and being tracked. This is to better show (prove?) that this strategy will work under Live Trading Conditions.
THE TRADE
The pair was breaking out of a large Consolidation on the Daily Chart. The Daily Chart gave a Signal indicating a buying opportunity to take advantage of the move and the 4H Chart provided a strong area for the Stop Loss. Recall that my Signals for entry come from the FXCM platform because this uses the New York Close Candle of the Daily Chart which is crucial to Price Action strategies like mine.
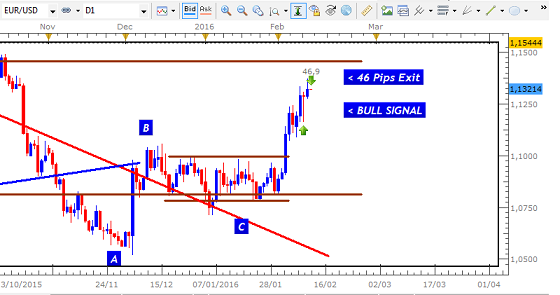
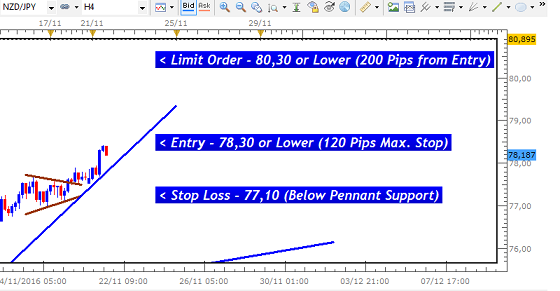
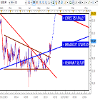
DAILY CHART PENNANT SETUP
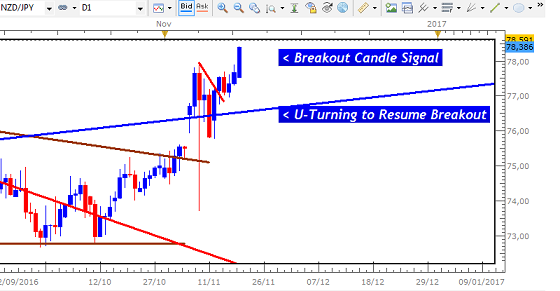
DAILY CHART SIGNAL
4 H CHART SETUP

You can view the Video Analysis of the trade below as well as the Video on the 2 main factors required to be a good Swing Trader trading setups like this.
/NOVEMBER_29_2016_VIDEO_ANALYSIS_ADV_198_PIPS.png" target="_blank" rel="noopener noreferrer nofollow">
/NOVEMBER_29_2016_VIDEO_ANALYSIS_ADV_NEVER_WATCH.png" target="_blank" rel="noopener noreferrer nofollow">
The Main Technical Factors Supporting the trade were:
- Being Able to Accurately Identify Consolidation Breakouts
- Determining the Right Signals to Trade on the Daily Chart
- Using Only the Strongest Areas for your Stop Losses in order to Protect Your Trade
- Patience to Hold Trades for up to 6 Days
. Discipline to NEVER look at your trades while they are open in order to avoid Sabotaging your Profitability
Comments welcomed
Duane
DRFXSWINGTRADING
첨부 파일:
Trade Less, Earn More
Nov 19, 2014 부터 멤버
게시물157
Dec 04, 2016 at 09:56
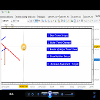
Correction to the above...1st Graph is 4H, 2nd Graph is Daily Chart Break Signal, 3rd Graph is the Daily Pennant Consolidation.
Apologies for mix up.
Regards
Duane
Apologies for mix up.
Regards
Duane
Trade Less, Earn More
Dec 08, 2016 부터 멤버
게시물19
Dec 12, 2016 at 09:58
With this knowledge you did not want to become a big broker and rasshiret your business?
Nov 19, 2014 부터 멤버
게시물157
Dec 27, 2016 at 07:26
Need more than knowledge..Lend me the capital to do it and we can be partners!!
Trade Less, Earn More
Nov 19, 2014 부터 멤버
게시물157
Dec 27, 2016 at 07:30
Hey Traders how goes it!!,
Just to give you an update...
Every year, I aim to achieve a targeet of at least 100% Rate of Return. I think that if you can achieve these results within a Year as a Swing Trader who doesnt want/have the time to stay glued to the market, youll put yourself in a good position Long-Term.
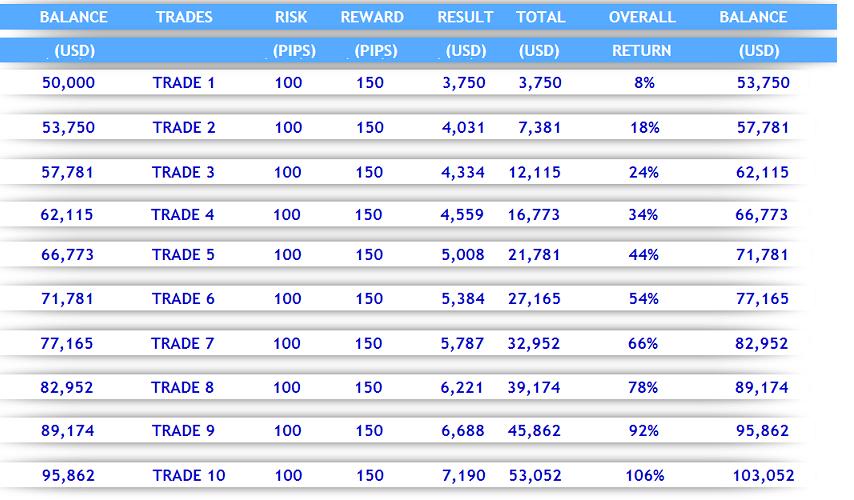
I target 100-200 Pips per trade, using Stop Losses of 100 Pips on average, trading the Daily and 4 Hour Charts. I use a 5% Risk Per Trade.
The table above assumes an average gain of 150 Pips. So the idea is that you only trade a few times a month to target the best setups, that have the Highest Probability of success.
For the 2015/2016 period, I was able to earn 46.43% after just 6 trades, which based on that table, would have meant that I only needed 5 more trades to achieve that minimum target. However, due to unusually low market liquidity, return was affected over the next few months, pushing down to the mid 20%. When conditions did improve, I was able to resume hitting large Pip targets which allowed the return to end the period at 42.43%. Not bad but much lower than what I expect from my system.
Heading into the 2016/2017 period,I am now up 9.0% after that one trade of 198 Pips on the NZD JPY that I highlighted in the previous post. So assuming normal conditions, would now need 9 Trades to hit that target. Of course, trading losses are expected along the way, but it is expected that once the market remains liquid, will not take long to reach that goal...and more.
If you dont want to watch the market every day and battle the volatile intra-day volatility, Swing Trading is your best bet.
Duane
DRFXSWINGTRADING

Just to give you an update...
Every year, I aim to achieve a targeet of at least 100% Rate of Return. I think that if you can achieve these results within a Year as a Swing Trader who doesnt want/have the time to stay glued to the market, youll put yourself in a good position Long-Term.
I target 100-200 Pips per trade, using Stop Losses of 100 Pips on average, trading the Daily and 4 Hour Charts. I use a 5% Risk Per Trade.
The table above assumes an average gain of 150 Pips. So the idea is that you only trade a few times a month to target the best setups, that have the Highest Probability of success.
For the 2015/2016 period, I was able to earn 46.43% after just 6 trades, which based on that table, would have meant that I only needed 5 more trades to achieve that minimum target. However, due to unusually low market liquidity, return was affected over the next few months, pushing down to the mid 20%. When conditions did improve, I was able to resume hitting large Pip targets which allowed the return to end the period at 42.43%. Not bad but much lower than what I expect from my system.
Heading into the 2016/2017 period,I am now up 9.0% after that one trade of 198 Pips on the NZD JPY that I highlighted in the previous post. So assuming normal conditions, would now need 9 Trades to hit that target. Of course, trading losses are expected along the way, but it is expected that once the market remains liquid, will not take long to reach that goal...and more.
If you dont want to watch the market every day and battle the volatile intra-day volatility, Swing Trading is your best bet.
Duane
DRFXSWINGTRADING
첨부 파일:
Trade Less, Earn More
Jun 01, 2011 부터 멤버
게시물4
Dec 29, 2016 at 03:42
Great work Duane.
Nov 19, 2014 부터 멤버
게시물157
Dec 29, 2016 at 11:33
IS IT DEMO "VS" LIVE.OR DEMO "THEN" LIVE?
There is a popular belief that Demo Trading doesnt prepare you for Live Trading. This couldnt be further from the truth.
Like other areas of life and other professions, if you dont prepare adequately in the simulated environment...

...you will not be successful. Even the greats need to practice.
This is why Demo Accounts were created. Because of how difficult this market is, achieving Profitability with fake money is the only guarantee you will do so with Real Money. Otherwise, Disaster awaits.
The consequence will be that instead of your Live Account giving you profitable results by being dependent on a Successful Strategy rather than Emotions or Luck,
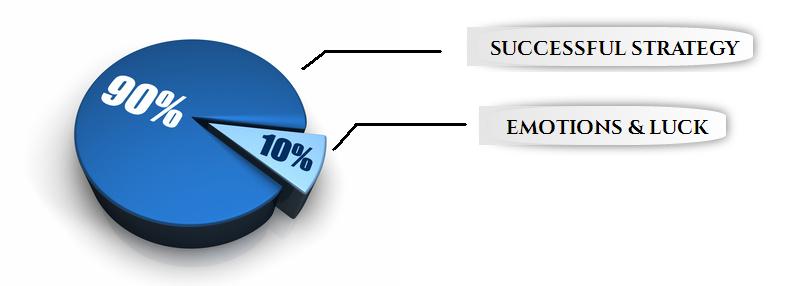
it will produce losses after losses by being dependent on a Emotions & Luck..

Since a 200 Pip Move on the EURO USD is the same on a Demo as it is on a Live, if you have a successful strategy that captures this on a Demo, you will be able to do that on a Live.
What would stop you?
Duane
DRFXSWINGTRADING


There is a popular belief that Demo Trading doesnt prepare you for Live Trading. This couldnt be further from the truth.
Like other areas of life and other professions, if you dont prepare adequately in the simulated environment...
...you will not be successful. Even the greats need to practice.
This is why Demo Accounts were created. Because of how difficult this market is, achieving Profitability with fake money is the only guarantee you will do so with Real Money. Otherwise, Disaster awaits.
The consequence will be that instead of your Live Account giving you profitable results by being dependent on a Successful Strategy rather than Emotions or Luck,
it will produce losses after losses by being dependent on a Emotions & Luck..
Since a 200 Pip Move on the EURO USD is the same on a Demo as it is on a Live, if you have a successful strategy that captures this on a Demo, you will be able to do that on a Live.
What would stop you?
Duane
DRFXSWINGTRADING
첨부 파일:
Trade Less, Earn More

*상업적 사용 및 스팸은 허용되지 않으며 계정이 해지될 수 있습니다.
팁: 이미지/유튜브 URL을 게시하면 게시물에 자동으로 삽입됩니다!
팁: @기호를 입력하여 이 토론에 참여하는 사용자 이름을 자동으로 완성합니다.


