


Advertisement
USD/JPY

Oct 11, 2013 부터 멤버
게시물769
Oct 02, 2018 at 02:22
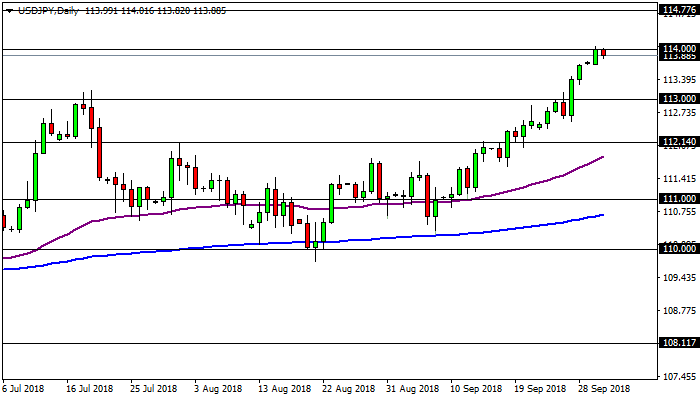
Rally continues on the USD/JPY. On the daily chart of the USD/JPY we can see a very sustainable and organized rally on the pair, since it last visited its 200 day EMA (blue line). On its way up, the pair has made some pullbacks, but that has contributed to keeping the momentum on the bullish trend. The pair reaches the 114.00 level, which could act as resistance. In case of a bearish bounce from the 114.00 level, the 113.00 level could act as support, which acted as resistance in the past. On the other hand, if the USD/JPY continues rallying, then the 114.77 level could act as resistance.
첨부 파일:
Oct 02, 2018 at 18:06
USD/JPY failed to extend gains above the 114.00 level today and currently is suffering some modest losses around 113.77. Looking to the upside, a potential decisive break above 114 (daily high), will bring next bullish target at 114.70, followed by 115.00 (the psychological level). The downside offers supports at 113.60 (the daily low), 112.55 and 111.60.
forex_trader_436974
Jun 13, 2017 부터 멤버
게시물51
Oct 04, 2018 at 07:48
I'm still bullish on USDJPY too. I thought yesterday might be the end of the run, but today it's pushing upward again.
Oct 04, 2018 at 18:25
After marking its highest daily close in more than year and a half at 114.53, the USD/JPY pair plumetted and fell to its lowest level for the day at 113.64.On the four hour time frame the price crossed to below the 20-day SMA, which has turned to south, but meanwhile is staying above the bullish 50-day and 100-day SMAs. RSI is looking for direction around its mid-line and stochastic is showing strong bearish momentum. First bearish target is seen at 113.35 and the upside offers immediate resistance at 114.75.
Dec 10, 2017 부터 멤버
게시물210
Oct 07, 2018 at 08:57
The US dollar fell against the Japanese yen on Friday. By the close of US trading, USD / JPY is trading at 113.72, losing 0.15%. I believe that support is now at around 113.51, Tuesday’s low, and resistance is likely at 114.56, high on Thursday.
Dec 10, 2017 부터 멤버
게시물210
Oct 07, 2018 at 22:04
The wave is slowing down on USD/JPY.
Oct 09, 2018 at 19:46
USD/JPY dipped below 113.00 today, but reversed and started to retrace its losses. Now the pair is again below this level and indicators on the four hour time frame had lost directional strength. The price is developing below its moving averages and first resistance is provided by the flat 100-day SMA at 113.06.
Oct 10, 2018 at 18:29
As seen on the four hour time frame, the USD/JPY pair is struggling to preserve its early gains. The price is now looking for direction around the flat 100-day SMA and the bearish 20-day SMA. RSI and stochastic remain within negative territories, but both are directionless. There are no obvious signs for upcoming steeper recovery, as the pair will have to accelerate through 113.60 in order to enter into bullish ground, while a break below 112.75 would enlarge the risk toward the downside.
Oct 11, 2018 at 18:11
USD/JPY broke below the 100-day and 200-day SMAs, as seen on the four hour time frame and the last one is providing immediate resistance around 112.30 area, as bulls were unbale unable to advance beyond it. RSI and stochastic have corrected from extremely negative territories, but quickly resumed declines and still are developing in oversold territory, keeping the risk towards the downside.
Dec 10, 2017 부터 멤버
게시물210
Oct 12, 2018 at 17:12
The last day of the week the dollar recovered from the recent weakness and tries to hold 112.00 level with usd/jpy.
Oct 12, 2018 at 19:27
The short-term outlook for USD/JPY remains bearish. On the four hour time frame the price is hovering around the 200-day SMA, but unable to fight it. RSI and stochastic corrected from their extreme oversold territories before resuming their declines, and are back into the seep. A strong recovery above 112.60 would bring back the positive bias, but while staying undecisive around 112.00, the risk leans towards the downside.


