Based on visual analysis:

Aug 04 at 05:15
52 개의 뷰
1 Replies
Feb 15, 2024 부터 멤버   게시물8
Aug 04 at 05:15

Price reached a strong resistance near 3360.995, where multiple rejections occurred earlier.


A retracement zone (Sell Zone) is forming after a bullish move.


Previous support held near 3344.000 and 3340.000.


Likely sell target would be back to the support zone between 3344–3340.


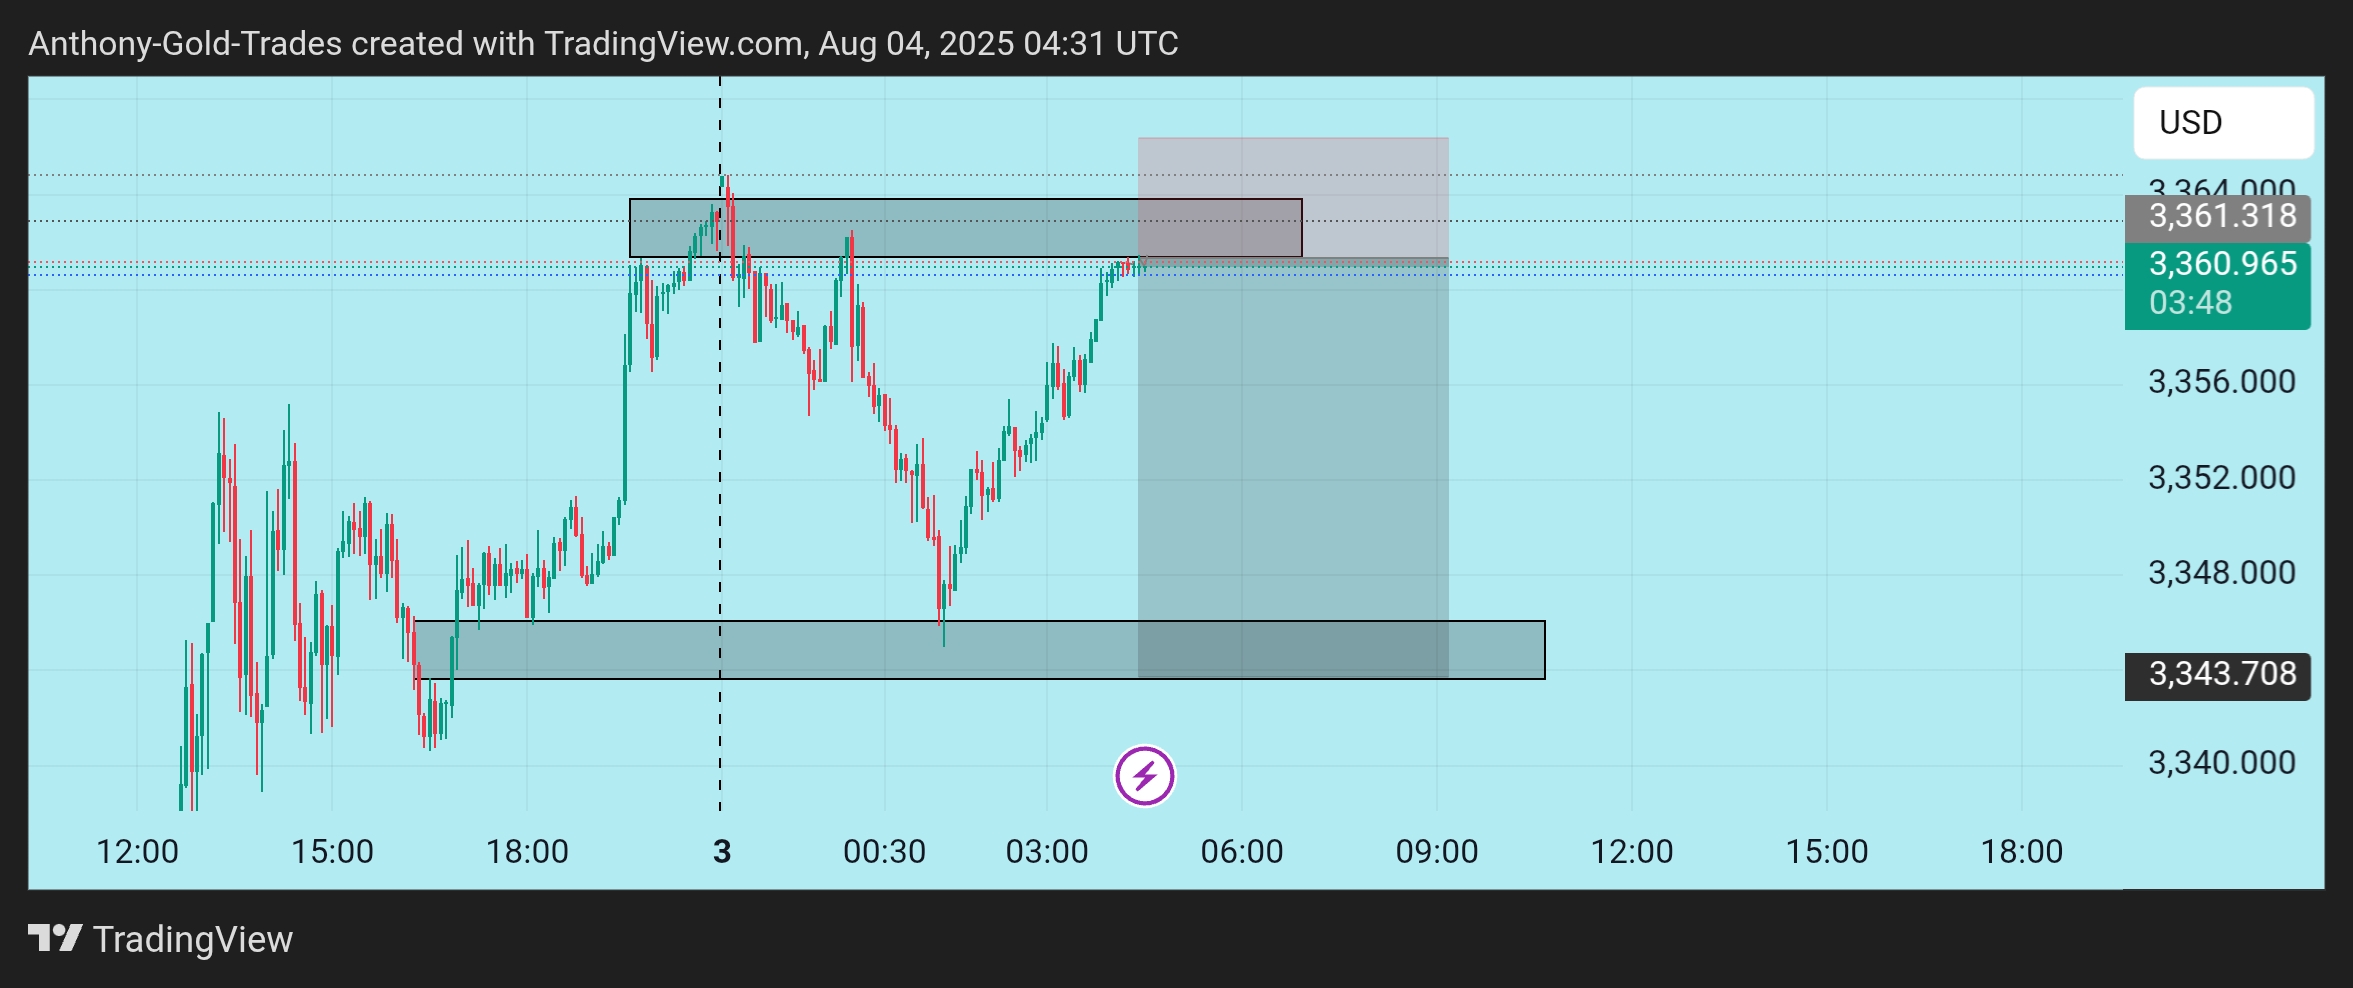
Feel Free To Ask Question's . My Telegram Contact User: @FSTrades12 . Telegram Channel. https://t.me/marcotrader21
May 17, 2025 부터 멤버   게시물4
Aug 09 at 15:53
Anthine posted:

Price reached a strong resistance near 3360.995, where multiple rejections occurred earlier.


A retracement zone (Sell Zone) is forming after a bullish move.


Previous support held near 3344.000 and 3340.000.


Likely sell target would be back to the support zone between 3344–3340.


Yes! XAU-USD reversed from special number 3350.00 and move upwards and special number 3400.00 holding for now. There are some special numbers and those are kept hidden behind the chart. Whenever you see reversals of price, then you should know 'There is a special number behind it'.If you see the XAU-USD H1 Chart, then you might noticed on 23 July 2025 there was a "Double Top" pattern created from the special number 3425.00. If you look closely: You'll see a "Bearish Head & Shoulder" as well.I have created a Trading Strategy. Everyday, beginning of the Asian session, mark it with a small box. Then, watch price action.


If candles move downwards from the marked box, Then you can expect a "Double Bottom Reversal Pattern". or


if candles move upwards from the marked box, Then you can expect a "Double Top Reversal Pattern"Remember: Price will always get reversals from hidden special numbers. So, you must know where are those numbers in the chart.


로그인 / 가입하기 to comment
You must be connected to Myfxbook in order to leave a comment
*상업적 사용 및 스팸은 허용되지 않으며 계정이 해지될 수 있습니다.
팁: 이미지/유튜브 URL을 게시하면 게시물에 자동으로 삽입됩니다!
팁: @기호를 입력하여 이 토론에 참여하는 사용자 이름을 자동으로 완성합니다.