





Gold in correction

Gold came under pressure this week, losing around 1.4% and retreating to $1966. This drops below previous local lows, forming a short-term downtrend and fitting into a pattern of declines following local overbought conditions.
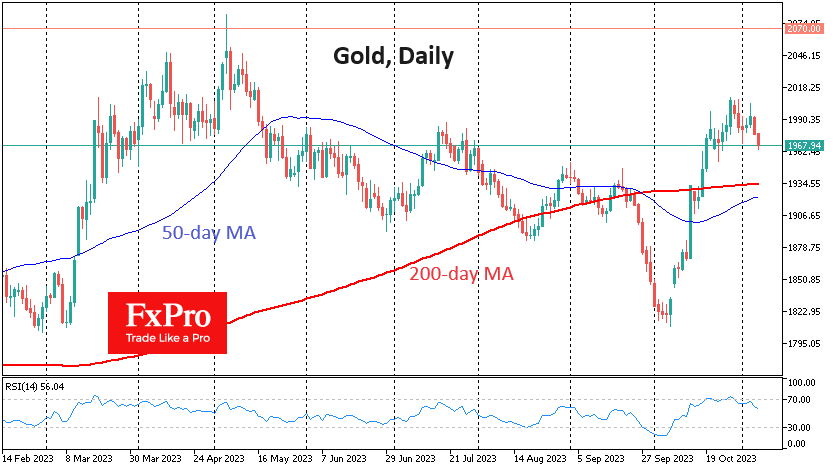
Gold has been in strong demand since the 7th following the war in Gaza. However, technical patterns are still at work. We have seen that the entry into the overbought area on the Relative Strength Index on the daily timeframe caused the growth to stall, and more active selling began early last week. As a result, the RSI retreated from the overbought area, which is often a medium-term signal for the end of growth and, at the very least, the beginning of a full-blown correction.
According to the Fibonacci pattern, we should pay more attention to the price dynamics around $1960, which is 76.4% of the amplitude of the October move. With strong buying interest, gold could find support and return to growth. Such shallow corrections are common in strong bull markets.
But we see more potential in a more profound correction with a pullback to $1932. The 61.8% retracement level, a classic Fibonacci pattern marker, is concentrated at this level. In addition, the 200-day moving average passes through here.
The ability to hold above this level will keep the focus on sustaining the bull market in gold. If the sellers don't stop here, the broader investment community could join in the selling. As in June 2022 or September 2023, a break below this line could be followed by a sharp decline. In the above cases, the price fell 8.5% and 6%, respectively, after a break below the 200-day average. Repeating this amplitude would wipe out October's gains or the gains of the last 12 months.
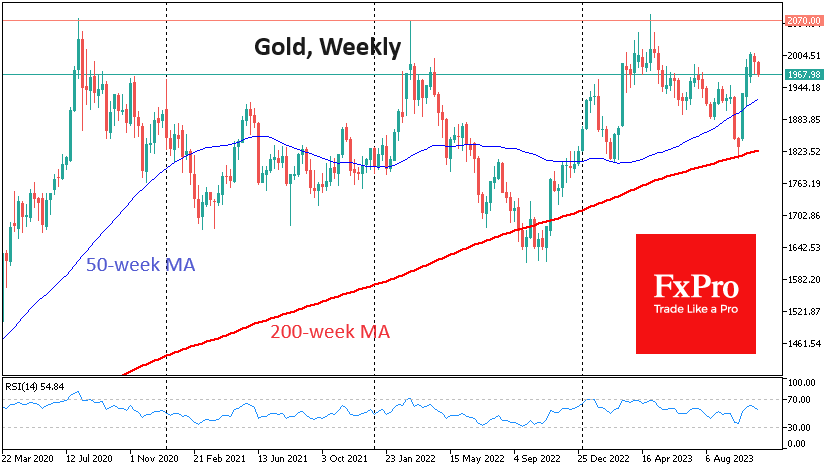
A fall back to near $1800 would take gold below the 200-week average, which it touched so nicely during the reversal in early October. However, it is rare to see such nice touches in gold. For example, a couple of them in 2017 failed to become a starting point for gold's rally, and only a dip below the 200-week average in late 2018 revived buying interest.
By the FxPro Analyst Team


SPX vs SPCX: Spot the Difference

Midweek Technical Look – AUDUSD, USDCAD, Nvidia

Today Fundamental Analysis: Dow Jones and the S&P 500 break new record highs on strong earnings

Today Technical Analysis: Gold jumps above $4,300 an ounce as the US dollar remains relatively weak

EBC Markets Briefing | Euro Stoxx 50 near record peak amid tech rally

Oil wavers amid doubts about Hormuz deal, stocks ease from record

Oil Markets Stabilize as Hormuz Agreement Eases Supply Concerns | 6th August, 2026