Market Insights & Trade Idea by AryanForex

Gold broke above $3450 last week, briefly touching $3500. Weak USD, Fed concerns, and geopolitical risks drive demand — but all eyes are now on U.S. jobs data.
📊🔍 Key Levels & Technicals
Next resistances: $3550, $3600, $3657.Below $3400, a pullback is likely. RSI is near 70 but the trend remains strong.
🧑🏫🇺🇸 U.S. Jobs: Key to Fed Policy and Gold’s Path
Friday’s NFP is critical. July revisions matter more than August’s new data. Forecast: only +68K jobs.Weak results may trigger a Fed rate cut cycle (up to 100bps) — bullish for gold. Strong data may slow the rally.
aryanfx posted:
🥈🚀 Silver: Strong Resistance Around $41
On Monday, during shortened U.S. trading hours, silver hit a new high at $40.76, breaking above last week's $39.97 peak. It even moved beyond the upper edge of a long-term ascending channel, confirming continued bullish momentum.
📌 But the $40.86–41.09 zone holds key resistances:
200% extension of a recent pullback
127.2% Fibonacci extension of 2021 drop
161.8% target of a short-term ABCD pattern
🔄 This zone may act as a pause or consolidation area. Still, the broader uptrend remains intact. August's monthly close above July's peak confirms strength in the larger time frame.
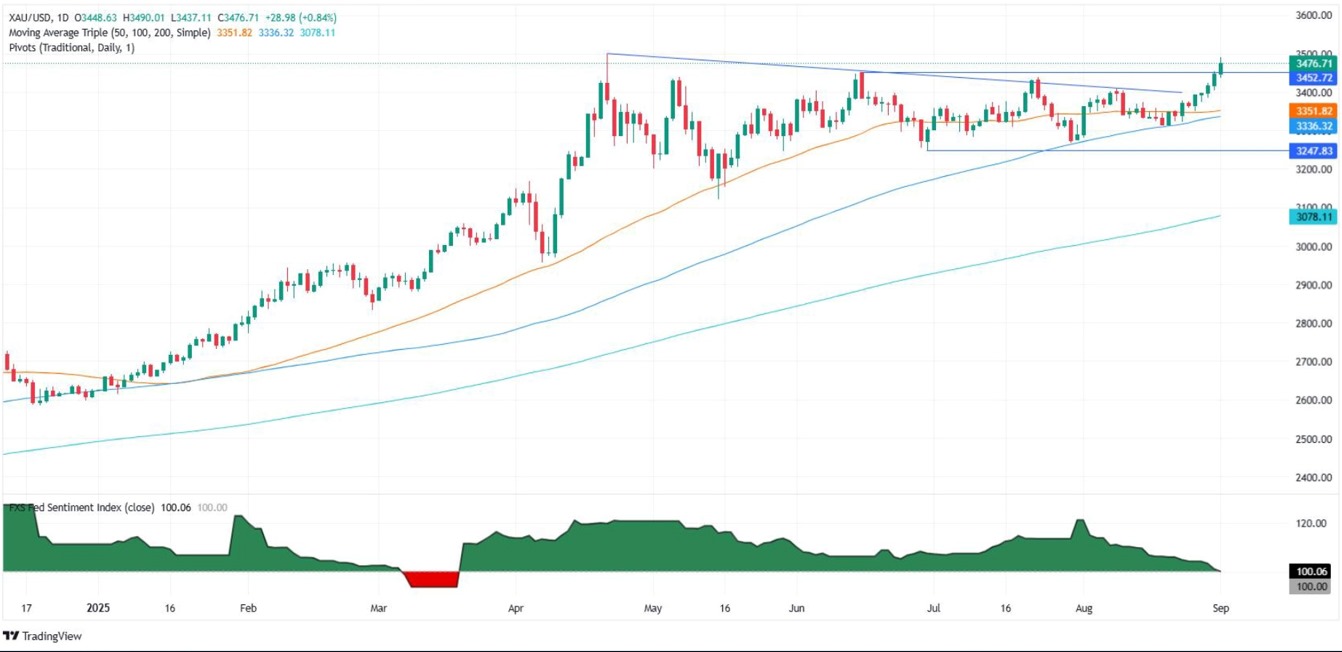
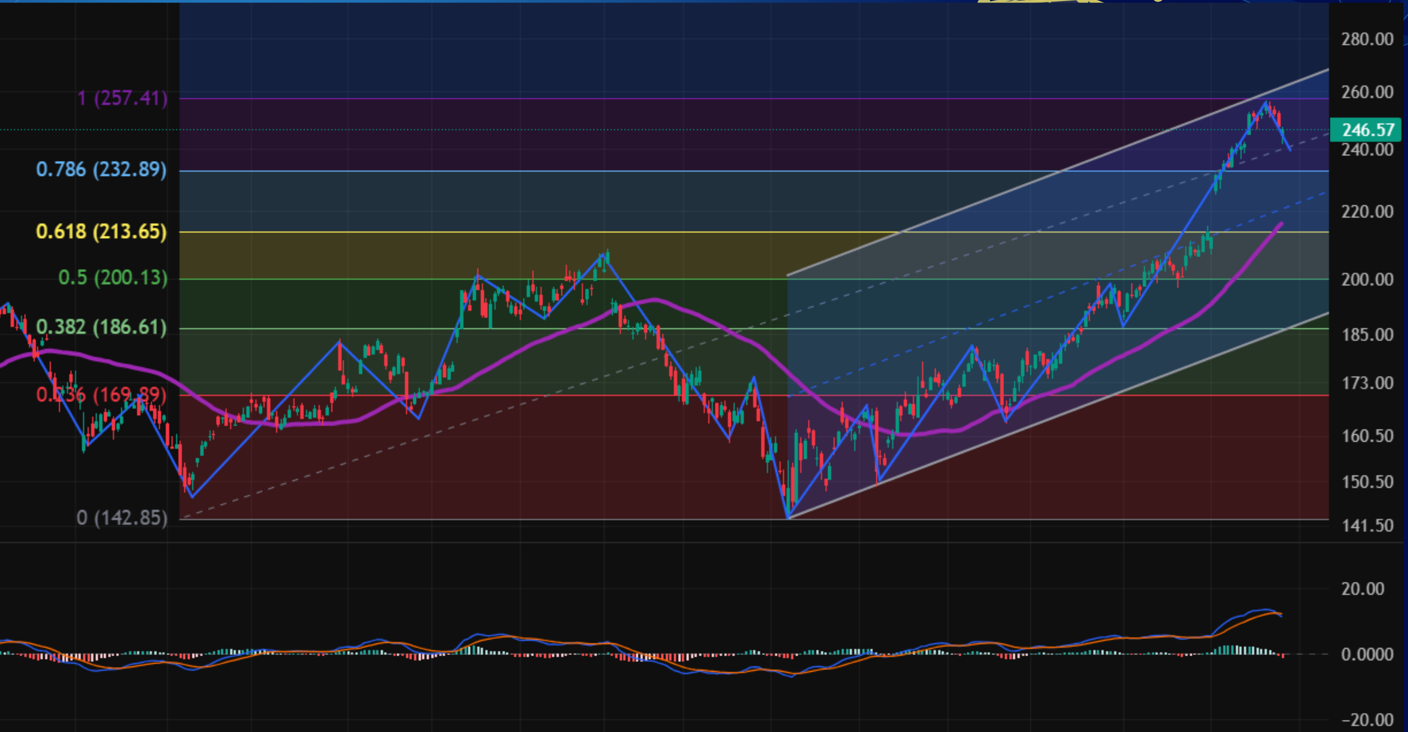
📊 Gold broke above the key $3500 resistance and set a new record high. With strengthening technical indicators and 88% market bullish sentiment, the uptrend appears sustainable. Next targets are $3550–$3579, with potential extension toward $3657.
⚠ In case of a pullback, key support lies at $3404. A break below may open the path to $3351. However, current corrections are shallow, indicating strong upward momentum.
📉 On the macro side, economic growth is slowing, the labor market is weakening, and stagflation risks are rising. Gold continues to benefit as both an inflation hedge and a crisis hedge.
🔧 Resistance levels: 3550, 3579, 3657, 3673, 3705🔧 Support levels: 3437, 3404, 3351, 3311, 3268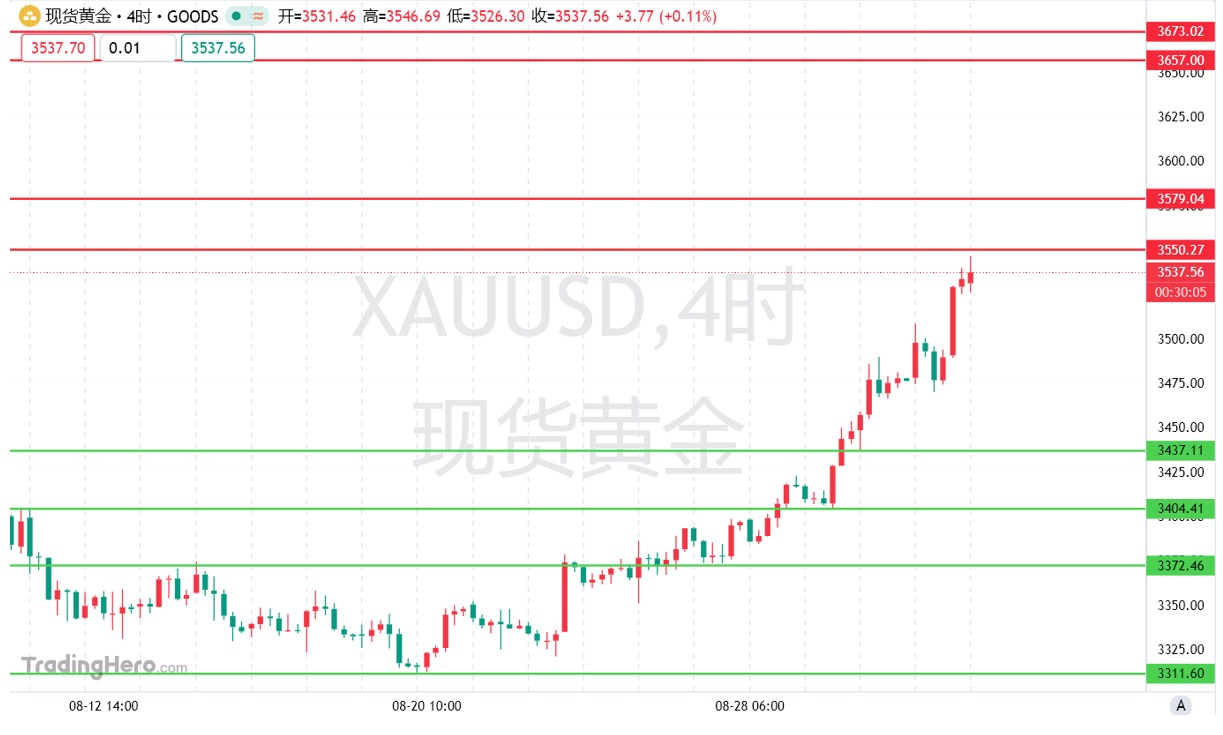
aryanfx posted:
🥈🚀 Silver: Strong Resistance Around $41
On Monday, during shortened U.S. trading hours, silver hit a new high at $40.76, breaking above last week's $39.97 peak. It even moved beyond the upper edge of a long-term ascending channel, confirming continued bullish momentum.
📌 But the $40.86–41.09 zone holds key resistances:
200% extension of a recent pullback
127.2% Fibonacci extension of 2021 drop
161.8% target of a short-term ABCD pattern
🔄 This zone may act as a pause or consolidation area. Still, the broader uptrend remains intact. August's monthly close above July's peak confirms strength in the larger time frame.
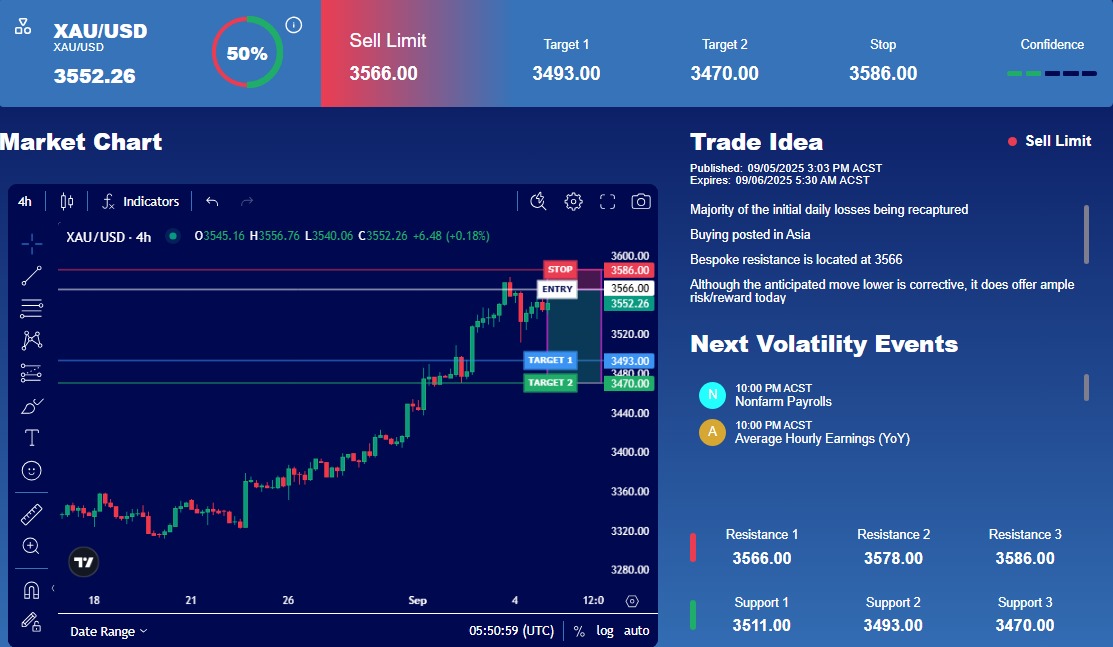
📌Trade Idea– XAU/USD📥 Sell Limit : 0.3566
🎯 TP1: 0.3493🎯 TP2: 0.3470
▪ 🔓 SL Trail if in profit
🛡 Stop Loss: 0.3586💎 Market moving in our favor – manage your trade accordingly!
✍ TP targets are a bit extended — you’re free to exit earlier with smaller gains💰.
aryanfx posted:
🥈🚀 Silver: Strong Resistance Around $41
On Monday, during shortened U.S. trading hours, silver hit a new high at $40.76, breaking above last week's $39.97 peak. It even moved beyond the upper edge of a long-term ascending channel, confirming continued bullish momentum.
📌 But the $40.86–41.09 zone holds key resistances:
200% extension of a recent pullback
127.2% Fibonacci extension of 2021 drop
161.8% target of a short-term ABCD pattern
🔄 This zone may act as a pause or consolidation area. Still, the broader uptrend remains intact. August's monthly close above July's peak confirms strength in the larger time frame.
📌Live Trade– GBP/USD📥 Sell: 1.3585
🎯 TP1: 1.3466🎯 TP2: 1.3375
▪ 🔓 SL Trail if in profit
🛡 Stop Loss: 1.3627💎 If Markets move in our favor – manage your trade accordingly!
✍ TP targets are a bit extended — you’re free to exit earlier with smaller gains💰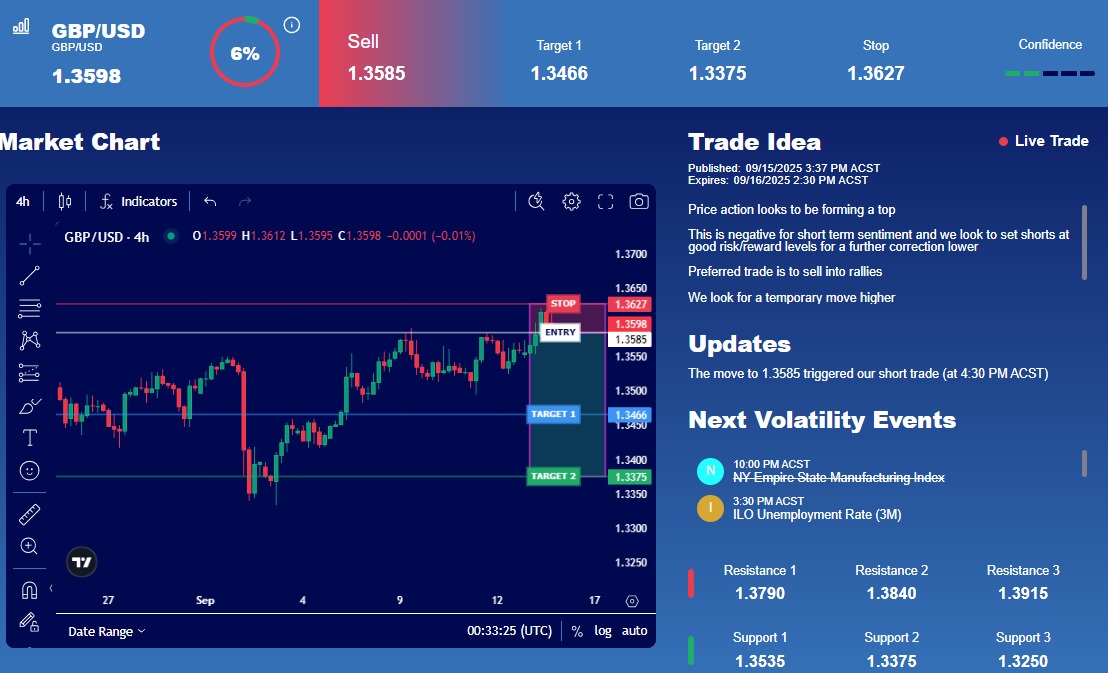
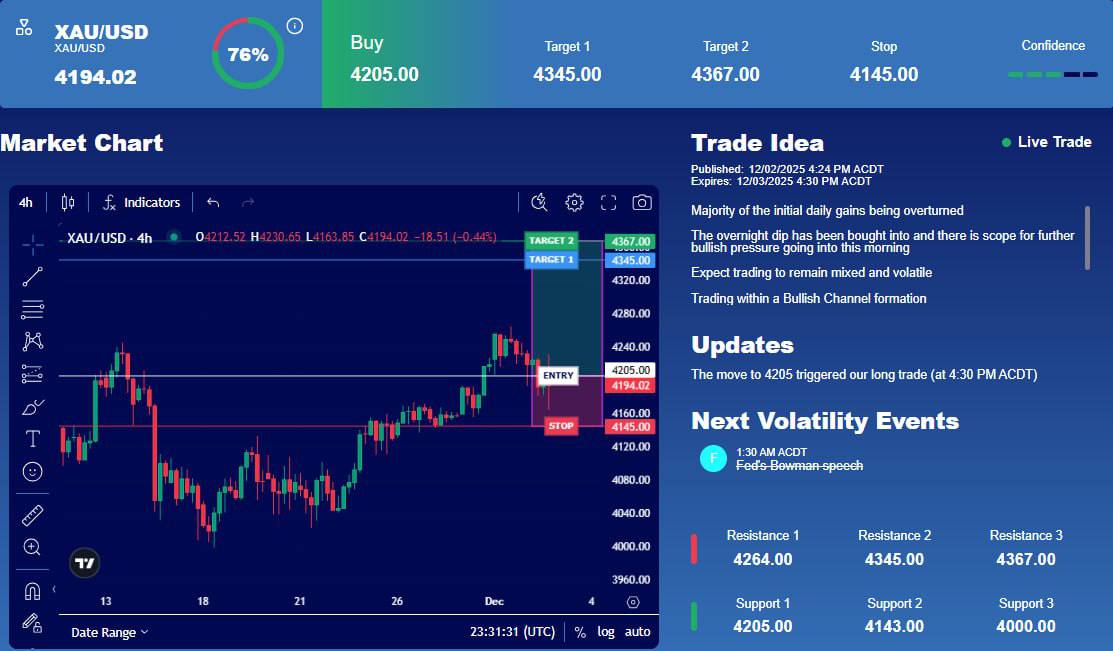
📌Live Trade– XAU/USD📥 Sell: 3714.00
🎯 TP1: 3621.00🎯 TP2: 3468.00
▪ 🔓 SL Trail if in profit
🛡 Stop Loss: 3744.00💎 If Markets move in our favor – manage your trade accordingly!
✍ TP targets are a bit extended — you’re free to exit earlier with smaller gains💰.

Barclays has reiterated its "hold" rating for Meta (NASDAQ: META) shares, citing the potential revenue growth from the WhatsApp and Threads platforms as the main reason. The investment firm forecasts that by 2026 and 2027, WhatsApp and Threads could generate an additional $6 billion and $19 billion in advertising revenue, respectively. These projections are based on Meta’s impressive current financial performance, with revenue of $178.8 billion, reflecting a 19.37% year-over-year growth.
📲 Advertising in WhatsApp Status, which has over 1.5 billion daily active users, generates a large volume of ad inventory with lower user acquisition costs, 🌐 while Threads, although smaller, has higher revenue potential due to its user base in higher-income regions, 📌 and the analyst recommends buying META shares around the $727 price level.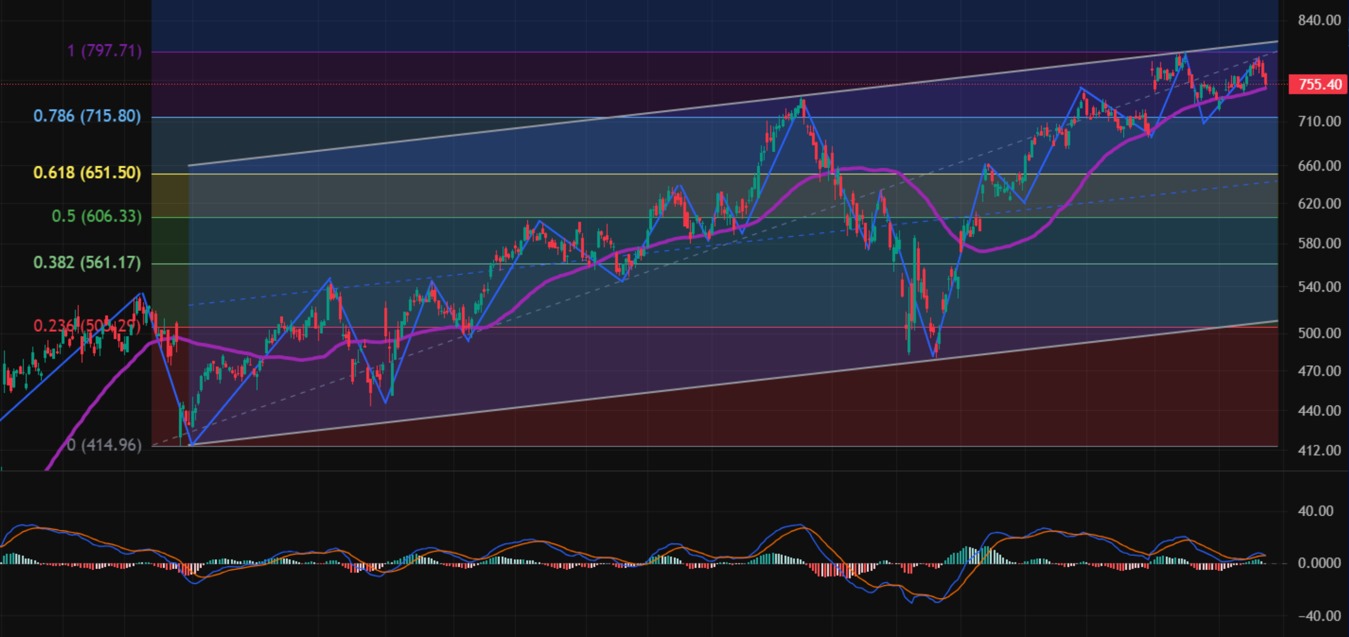
📈 Trading Product: Google NASDAQ: GOOG
Reports indicate that Meta is exploring the use of Google’s AI models — including Gemini and Gemma — to enhance its advertising performance. These models are expected to help improve content understanding and enable more accurate ad targeting, becoming part of Meta’s ad recommendation system. 🤖 The discussions are still in early stages and no formal agreement has been reached yet, but if they progress, it could benefit both companies. Under these conditions, buying Google stock around the $237 level may be worth considering.
Gold Technical Analysis: Potential Break Above $4000
Spot gold has broken the $3793 resistance and surpassed the September 23 high of $3791, confirming an uptrend from $3311. The next target is seen in the $3827–3847 range. Based on recent consolidation between $3719 and $3793, prices may rise to $3862.
Support lies between $3759 and $3772; a break below could trigger a drop to $3719.
On the daily chart, long-term targets are between $4031 and $4109, with a realistic target at $3905, representing 200% of the wave starting from $3246. 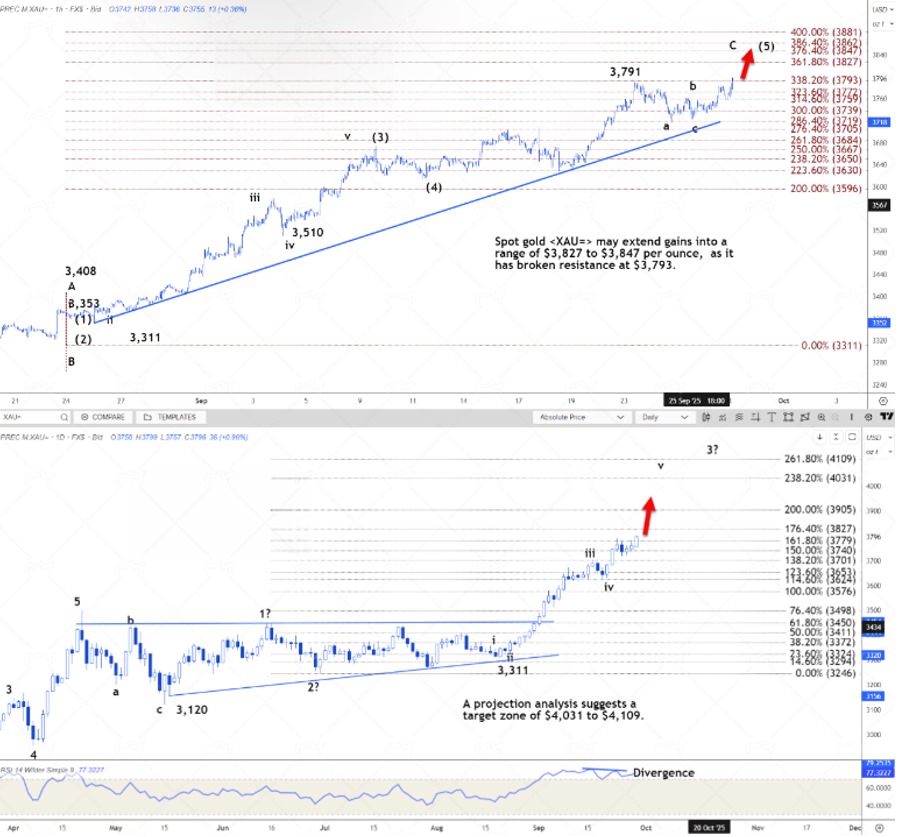
📌Live Trade– AUD/USD📥 Buy: 0.6490
🎯 TP1: 0.6570🎯 TP2: 0.6590
▪️ 🔓 SL Trail if in profit
🛡 Stop Loss: 0.6470💎 If Markets move in our favor – manage your trade accordingly!
✍️ TP targets are a bit extended — you’re free to exit earlier with smaller gains💰.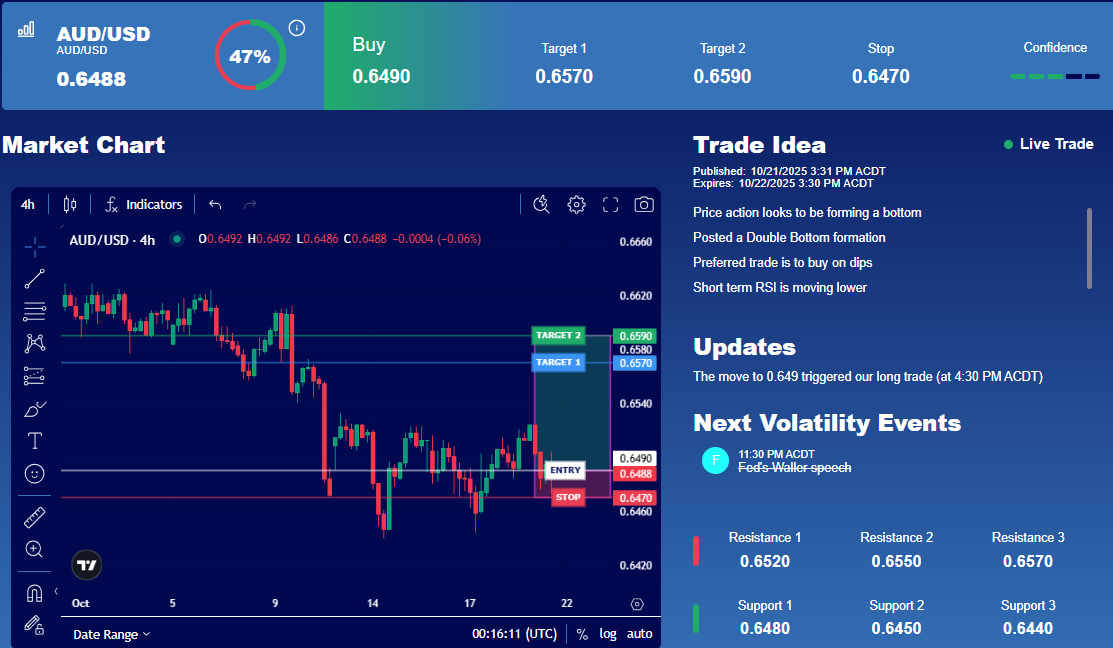
🇺🇸🤝🇦🇺 U.S.–Australia Critical Minerals Agreement
📊 Fundamental:U.S. President Trump and Australian Prime Minister Albanese signed a rare earth and critical minerals agreement on Monday at the White House. Albanese called it an $8.5 billion ready-to-go project. As part of the agreement, both sides agreed to cut approval procedures for mining and processing operations to boost production. They also plan to jointly invest over $3 billion in the next six months. The estimated resource value of the projects is $53 billion.
📉 Technical:On the H4 AUD/USD chart, price is fluctuating and hovering near the 48-period equilibrium line.MACD lines and histogram bars are converging near the zero axis, showing lack of clear market direction.
📌 Key Levels:1st Resistance: 0.65302nd Resistance: 0.65701st Support: 0.64402nd Support: 0.6400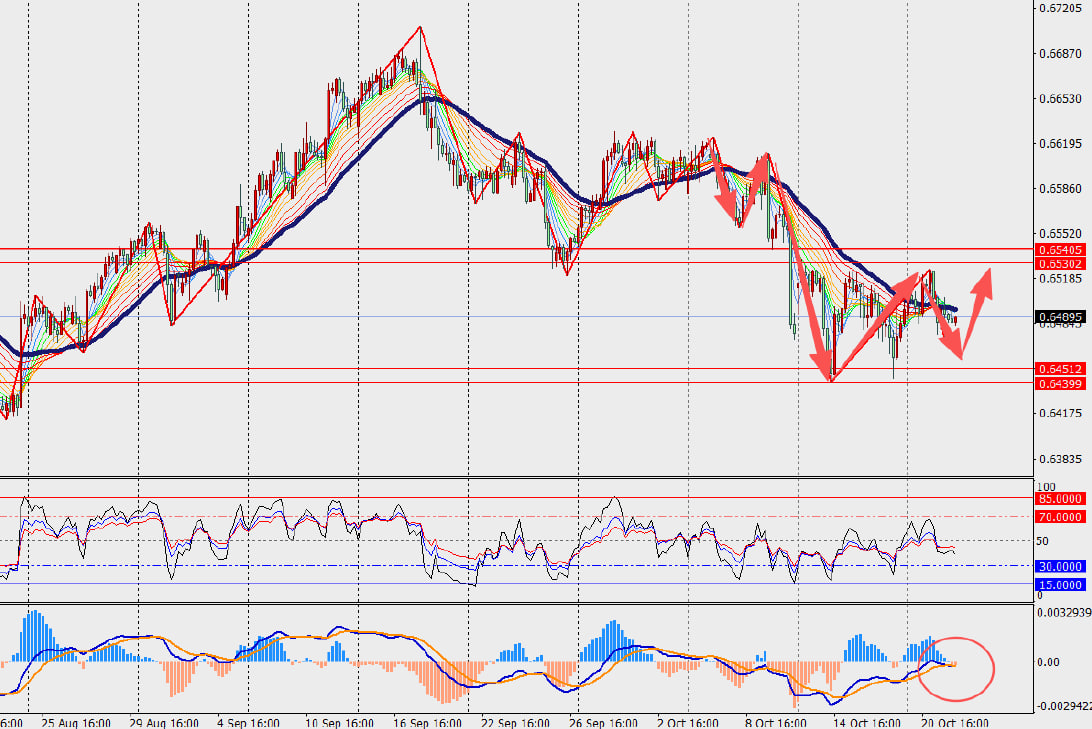
Euro to USD AnalysisThe movement of the euro is driven by economic data and trade developments in the Eurozone. Surveys indicate that Eurozone business activity in October grew faster than expected, especially in the services sector, and the PMI exceeded market forecasts, providing immediate support. Although weak US CPI benefits the euro, market pricing for a Fed rate cut is already fully reflected and has not amplified euro gains. Meanwhile, expectations for leader meetings inject some optimism into the euro, with investors hoping that trade easing will boost Eurozone exports.
💹 Technical AnalysisEUR/USD has faced resistance on the H4 chart and has pulled back, trading near the 48-day buy/sell boundary. Also, the MACD lines and volume bars have decreased near the zero axis. Key indicators this week, such as Germany’s business confidence index, labor market report, Eurozone unemployment rate, and GDP, will test economic resilience.
🛠 Key Levels
1st Resistance: 1.16801st Support: 1.15702nd Resistance: 1.17302nd Support: 1.1520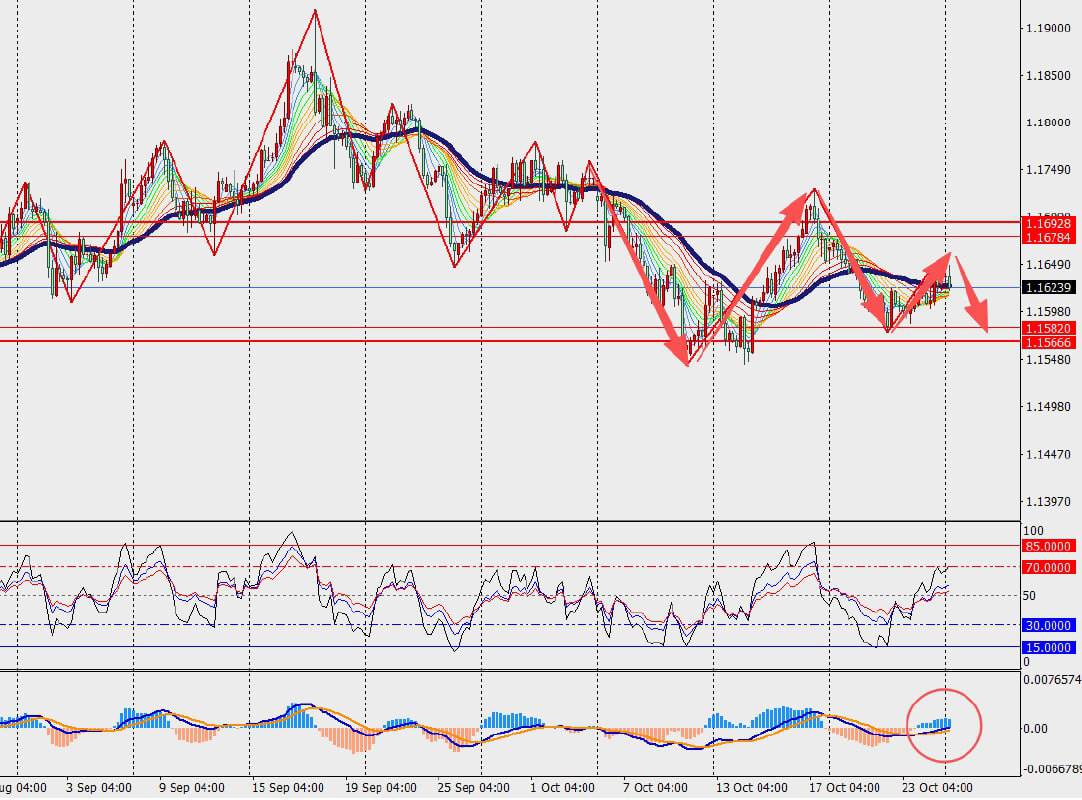
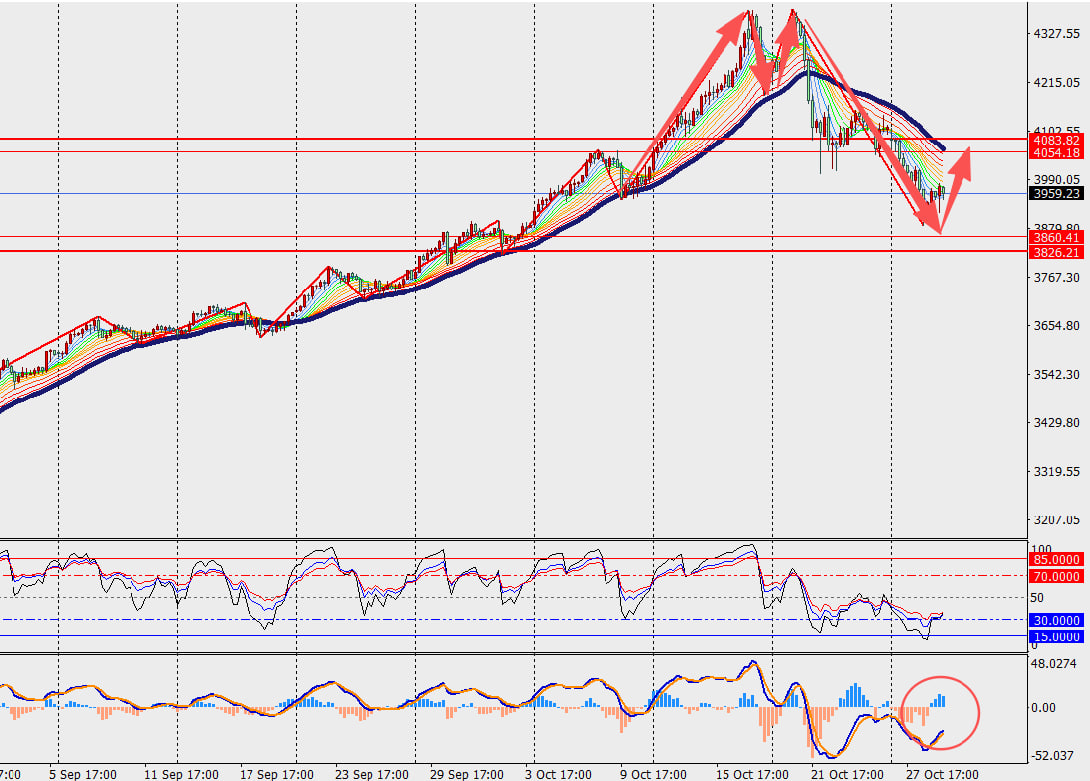
Gold Analysis
📈 FundamentalSenior officials from China and the U.S. have reached a consensus on the framework of a potential trade agreement, which has eased market concerns, but negotiations are not yet concluded. Additionally, with major central bank events approaching, investors are reluctant to take new bearish positions on gold, making this the key factor behind current price fluctuations.However, risks of escalating geopolitical tensions persist, providing some safe-haven demand support and preventing prices from dropping too far.
📊 TechnicalOn the H4 gold chart, prices are oscillating and rebounding but still trading below the 48-day long/short demarcation line. Additionally, MACD lines and volume bars are shrinking below the zero axis.Market attention will focus on Fed Chair Powell’s policy statement and press conference, particularly any forward guidance, as these will directly influence gold’s future trend direction.
🛡 Resistance & Support
1st resistance: 3977.001st support: 3940.002nd resistance: 3995.002nd support: 3920.00
Crude Oil Analysis
🛢 Fundamental:Market focus is on the White House meeting between President Trump and Hungarian Prime Minister Orbán. Investors hope this meeting could pave the way for Hungary to continue using Russian oil, easing supply concerns linked to sanctions.Meanwhile, data from Asia show a positive outlook — October crude imports rose both month-on-month and year-on-year, signaling steady demand.
Technical:On the 4-hour chart, crude oil has slightly rebounded and is fluctuating near the 48-day equilibrium line. The MACD is expanding below the zero axis, indicating downward pressure. U.S. crude inventories rose more than expected due to higher imports and slower refinery activity, creating selling pressure; however, declining gasoline and distillate inventories provided some support.
Key Levels:🔹 Resistance: 63.00 – 65.00🔹 Support: 58.00 – 56.00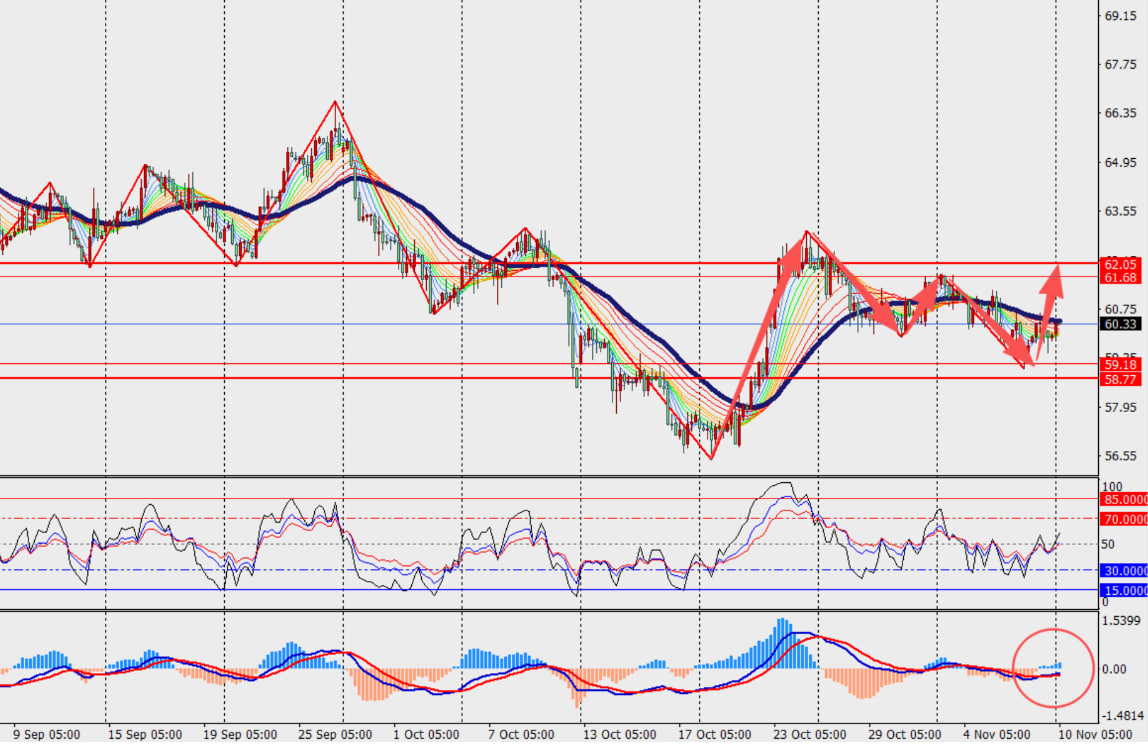
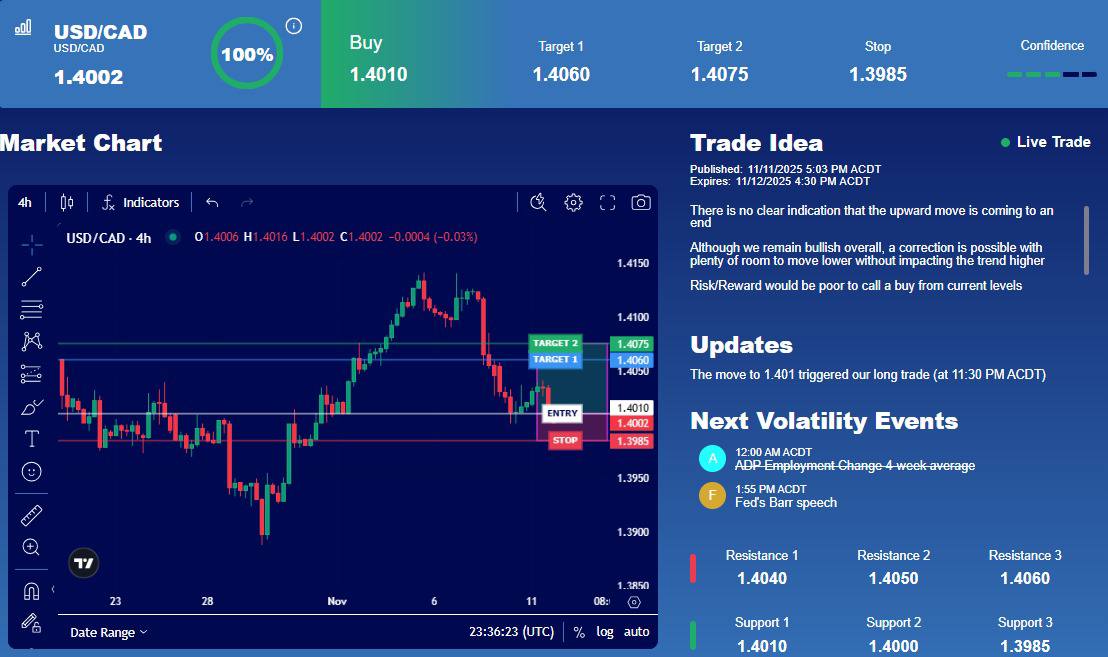
📌Live Trade– USD/CAD📥 Buy: 1.4010
🎯 TP1: 1.4060🎯 TP2: 1.4075
▪️ 🔓 SL Trail if in profit
🛡 Stop Loss: 1.3985💎 If Markets move in our favor – manage your trade accordingly!
✍️ TP targets are a bit extended — you’re free to exit earlier with smaller gains💰.