


Advertisement
who is guru???!!!

Membre depuis Aug 24, 2012
posts 138
Dec 21, 2012 at 15:57
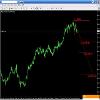
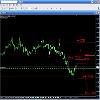
sell cad/jpy at 84.75, sl= 85.85, tp-1= 83.69, tp-2= 82.57, tp-3= 80.32
cad/jpy have completed wave 1 and wave 2 in 4 hour chart. now it is running in wave 3.
if wave 3 can't reach tp-3 then it will reach in wave 5.
by this trade cad/jpy daily trend has been changed to sell.
cad/jpy have completed wave 1 and wave 2 in 4 hour chart. now it is running in wave 3.
if wave 3 can't reach tp-3 then it will reach in wave 5.
by this trade cad/jpy daily trend has been changed to sell.
Fichiers joints:
Membre depuis Aug 24, 2012
posts 138
Dec 21, 2012 at 19:12
(édité Dec 21, 2012 at 19:14)
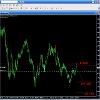
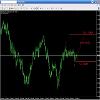
sell eur/usd at 1.3170, sl= 1.3310, Tp-1= 1.3107, tp-2= 1.2992, tp-3= 1.2762
eur/usd have completed wave 1 and wave 2 in 4 hour chart. now is following wave 3.
gbp/usd will follow same sell trend.
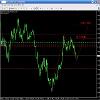
third picture, previous daily chart buy signal and projected tp-2. from where price retraced.
this daily chart shows the completion of wave 5.
so daily signal of eur/usd is also changed to sell.
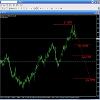
second picture, weekly chart where projected price level for 50% retracement is shown as completion of wave 4.
this retracement is same as weekly chart i posted earlier.
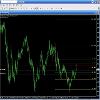
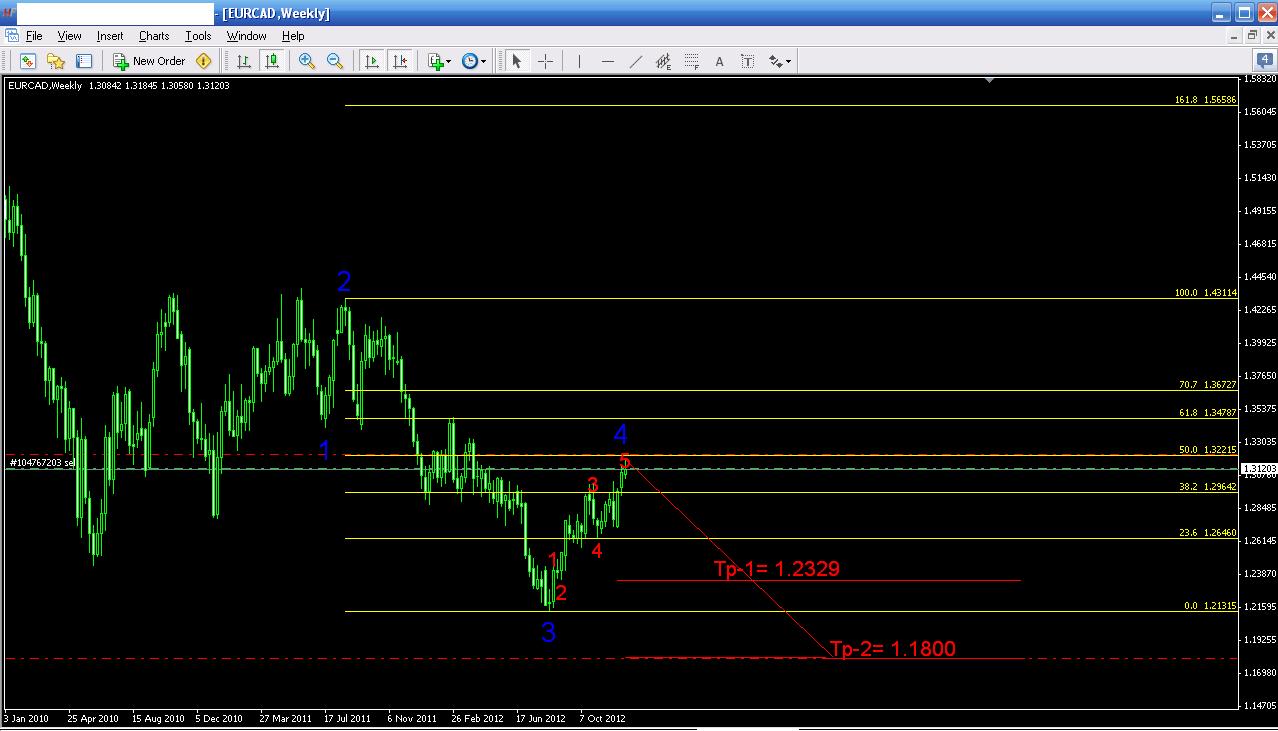
forth picture, weekly chart for new price projection. this can take 4+ months to reach tp-2.
where wave 4 has been completed and wave 5 has been started.
feel free to show your strong argument to prove that i am wrong in wave count.

eur/usd have completed wave 1 and wave 2 in 4 hour chart. now is following wave 3.
gbp/usd will follow same sell trend.
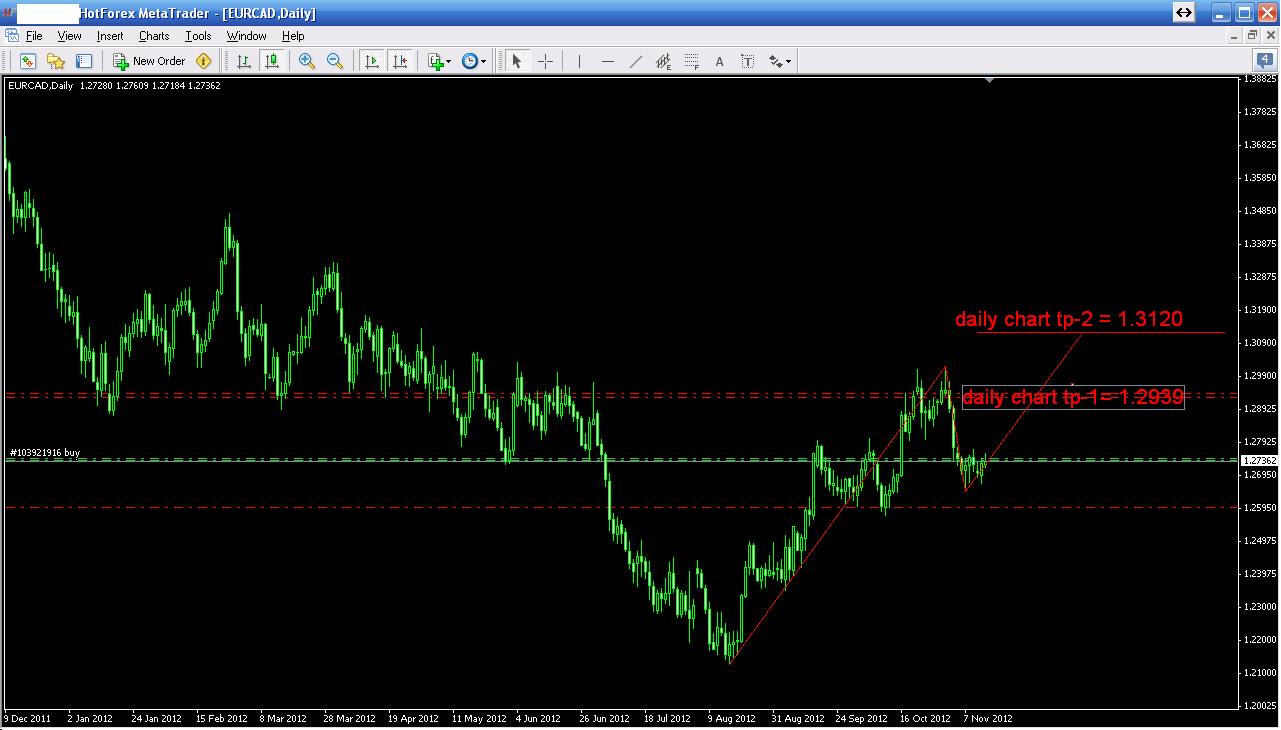
third picture, previous daily chart buy signal and projected tp-2. from where price retraced.
this daily chart shows the completion of wave 5.
so daily signal of eur/usd is also changed to sell.
second picture, weekly chart where projected price level for 50% retracement is shown as completion of wave 4.
this retracement is same as weekly chart i posted earlier.
forth picture, weekly chart for new price projection. this can take 4+ months to reach tp-2.
where wave 4 has been completed and wave 5 has been started.
feel free to show your strong argument to prove that i am wrong in wave count.
Fichiers joints:
Membre depuis Aug 24, 2012
posts 138
Dec 28, 2012 at 07:06
buy aud/usd at 1.0380, sl= 1.0313, tp-1= 1.0511, tp-2= 1.0615
it has completed wave 4 in daily chart. now it is following wave 5.
it has completed wave 4 in daily chart. now it is following wave 5.
Fichiers joints:
Membre depuis Aug 24, 2012
posts 138
Dec 28, 2012 at 10:15
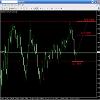
sell euro/cad at 1.3125, sl = 1.3225, tp-1= 1.2329, tp-2= 1.1800
this analysis is weekly basis. where it has completed wave 4 and now following wave 5.
weekly chart is shown below.
also daily analysis is shown below where it has completed wave 5.
this analysis is weekly basis. where it has completed wave 4 and now following wave 5.
weekly chart is shown below.
also daily analysis is shown below where it has completed wave 5.
Fichiers joints:
Membre depuis Aug 24, 2012
posts 138
Jan 02, 2013 at 16:48
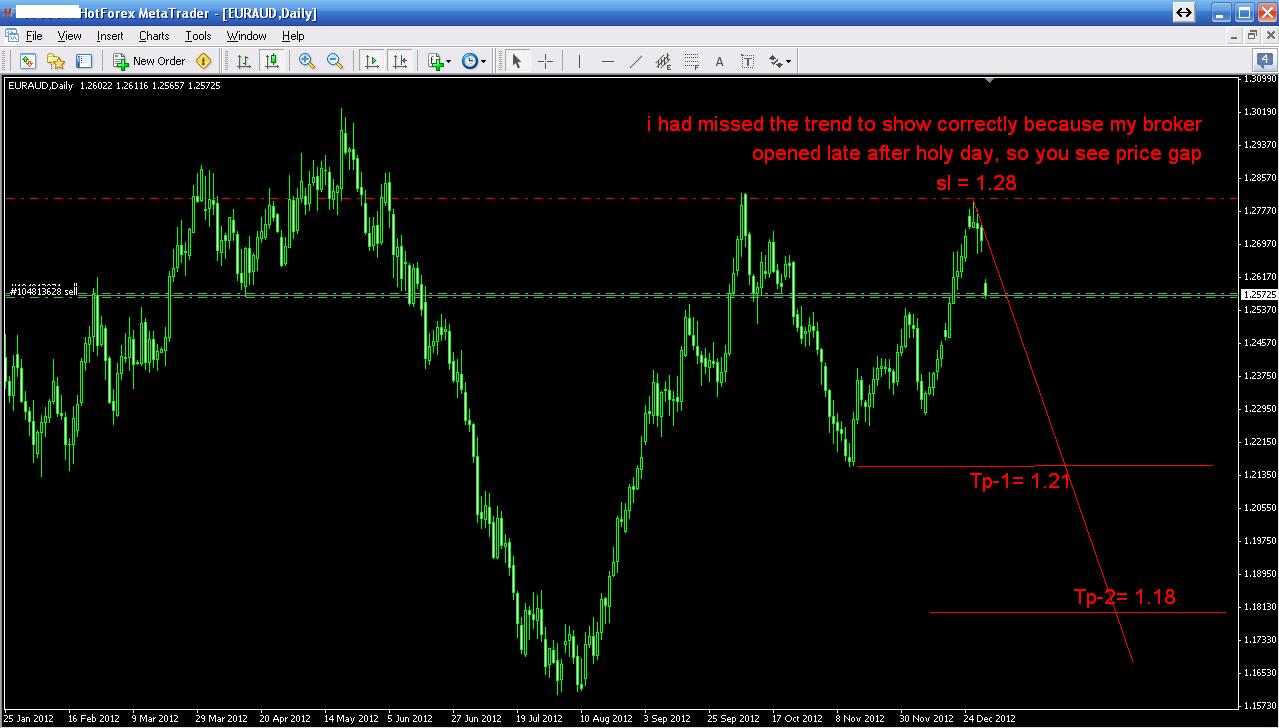
sell euro/aud, sl = 1.28, tp-1=1.21, tp-2= 1.18
Fichiers joints:
Membre depuis Aug 24, 2012
posts 138
Jan 02, 2013 at 17:00
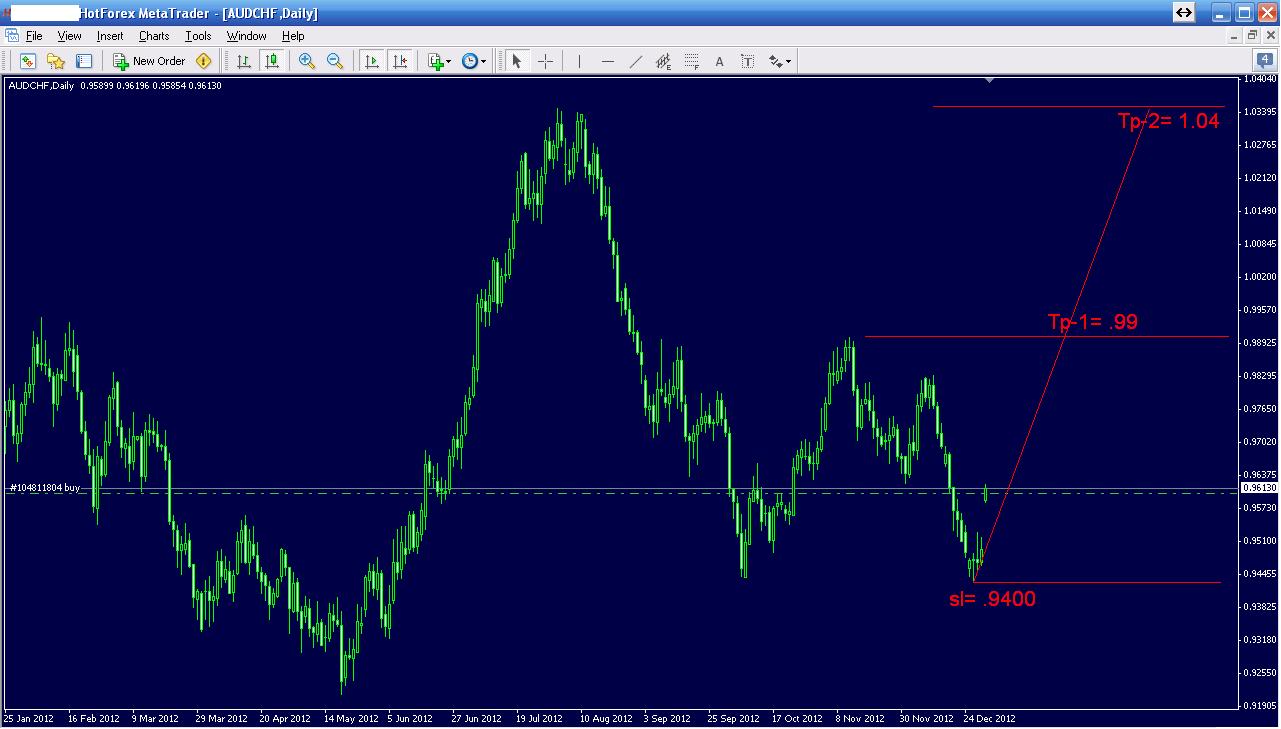
buy aud/chf, sl= .9400, tp-1= .9900, tp-2= 1.0400
Fichiers joints:
Membre depuis Aug 24, 2012
posts 138
Jan 02, 2013 at 17:40
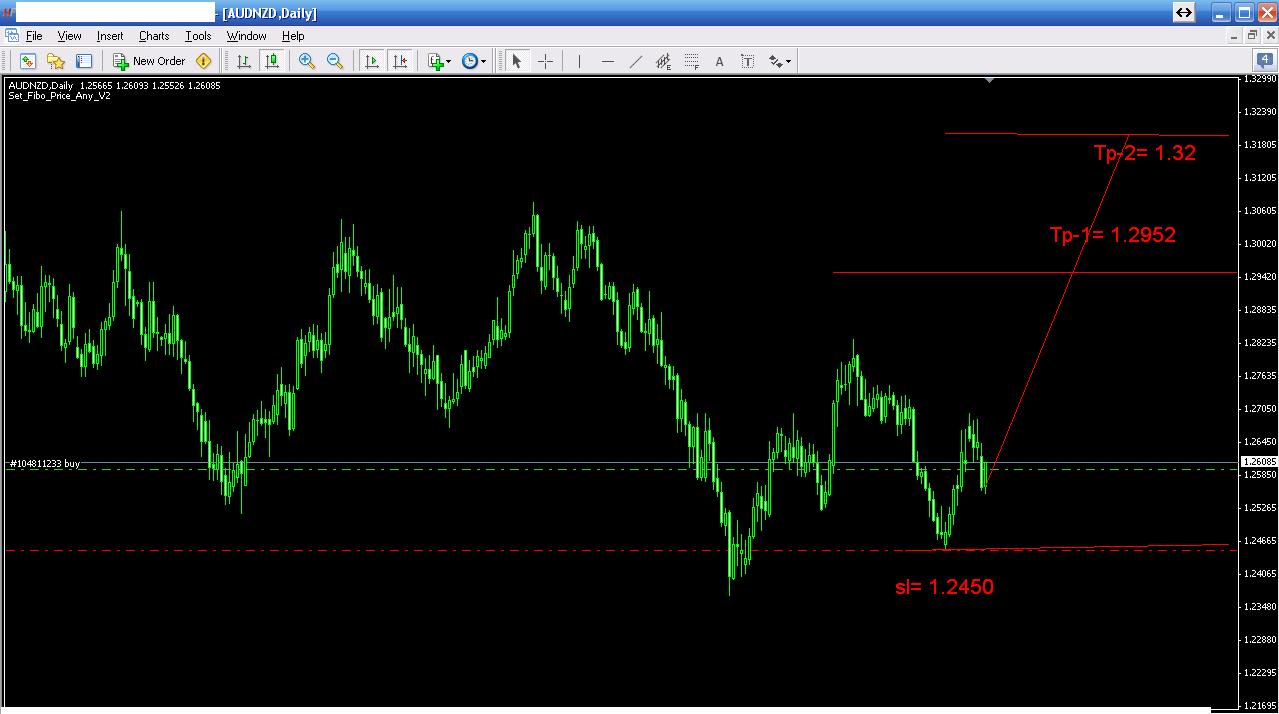
buy aud/nzd at 1.2600, sl= 1.2450, tp-1= 1.2952, tp-2= 1.32
Fichiers joints:
Membre depuis Aug 24, 2012
posts 138
Jan 03, 2013 at 03:20
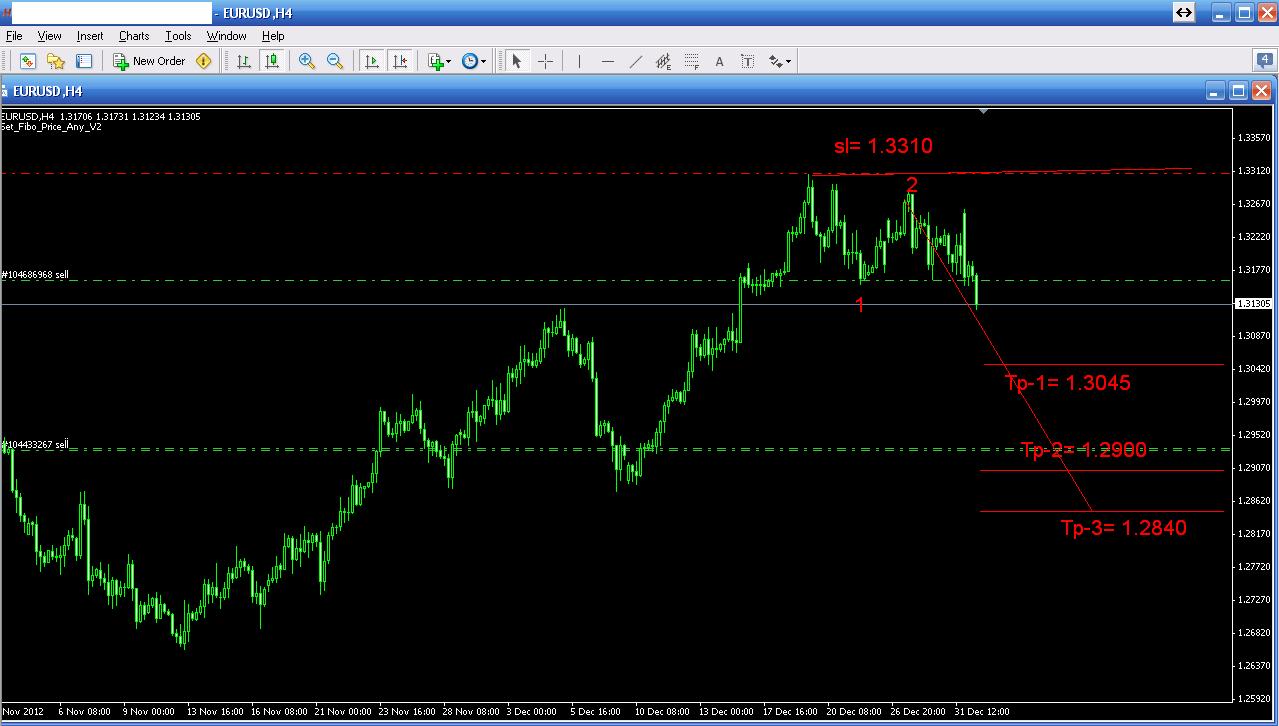
sell eur/usd with sl, 1.3310, tp-1= 1.3045, tp-2= 1.2900, tp-3= 1.2840
Fichiers joints:
Membre depuis Aug 24, 2012
posts 138
Jan 03, 2013 at 09:45
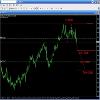
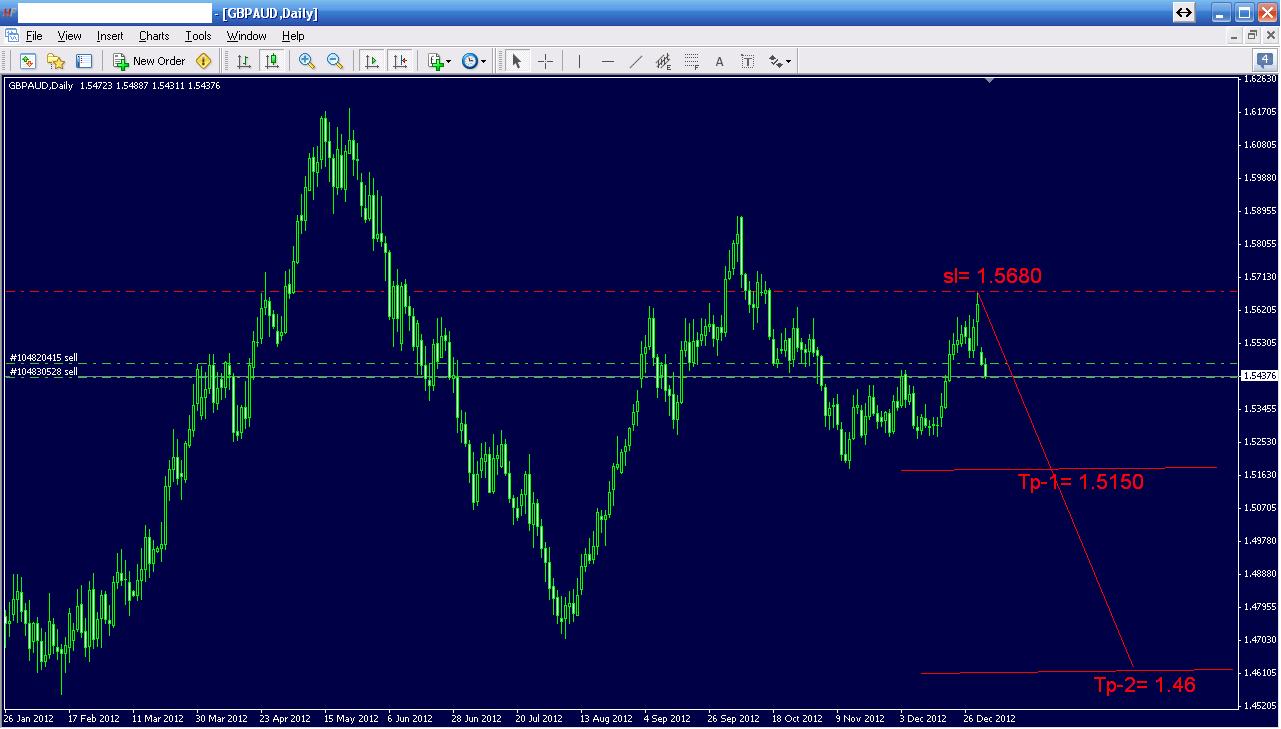
sell gbp/aud at 1.5475, sl= 1.5680, tp-1= 1.5150, tp-2= 1.4600
Fichiers joints:
Membre depuis Aug 24, 2012
posts 138
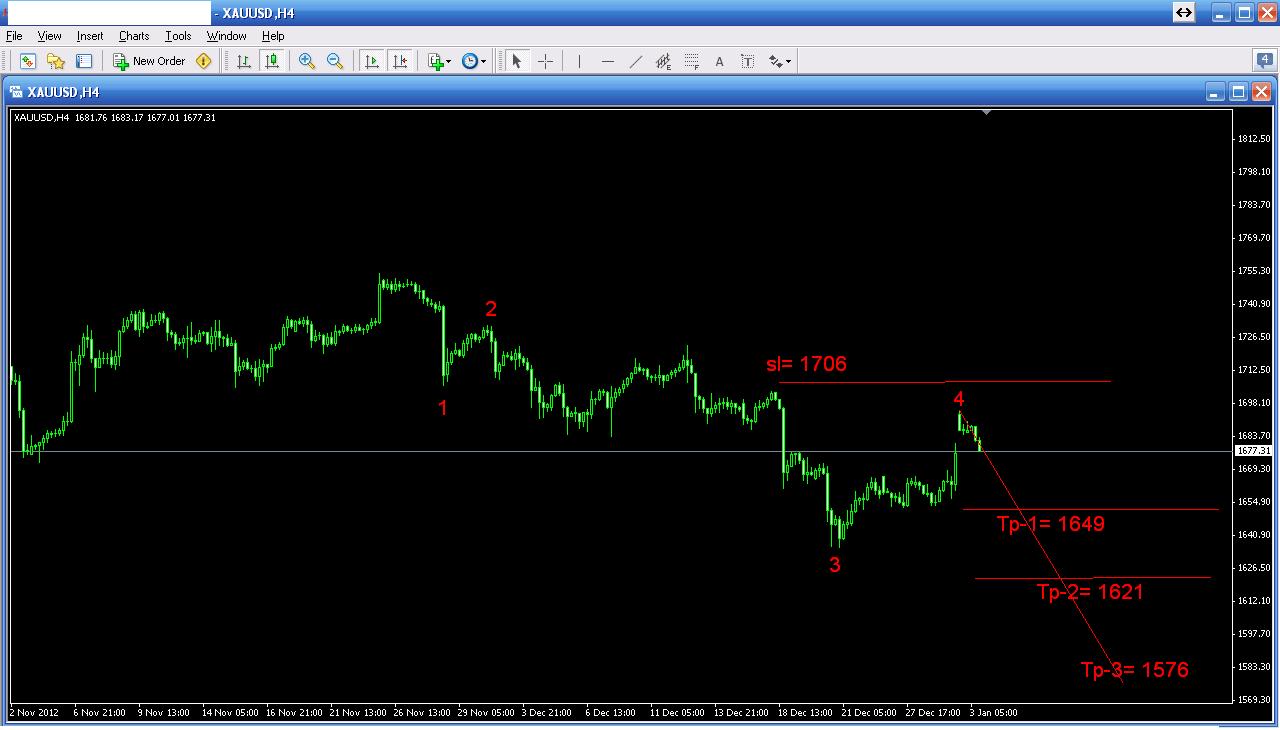
Jan 03, 2013 at 12:40
gold is in wave 5 in 4 hour time frame.
sell gold with sl= 1706, tp1= 1649, tp-2= 1621, tp-3=1576


sell gold with sl= 1706, tp1= 1649, tp-2= 1621, tp-3=1576
Fichiers joints:

Membre depuis Jul 01, 2011
posts 41
Jan 03, 2013 at 21:17
I noticed on your account statement (before you hid it) that there was a loss with 900 pips SL. 😲 I wonder where you got the idea of placing such a wide SL? The 30% drop in your account was in my opinion due to the fact that you were betting on the yen to go down again. I almost made the same mistake, but I got out in time. The Japanese central bank has declared war on other currencies (that's right, it is a currency war), and you should never fight a central bank! That is a lesson we all learn in time.
Membre depuis Aug 24, 2012
posts 138
Jan 03, 2013 at 21:26
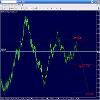
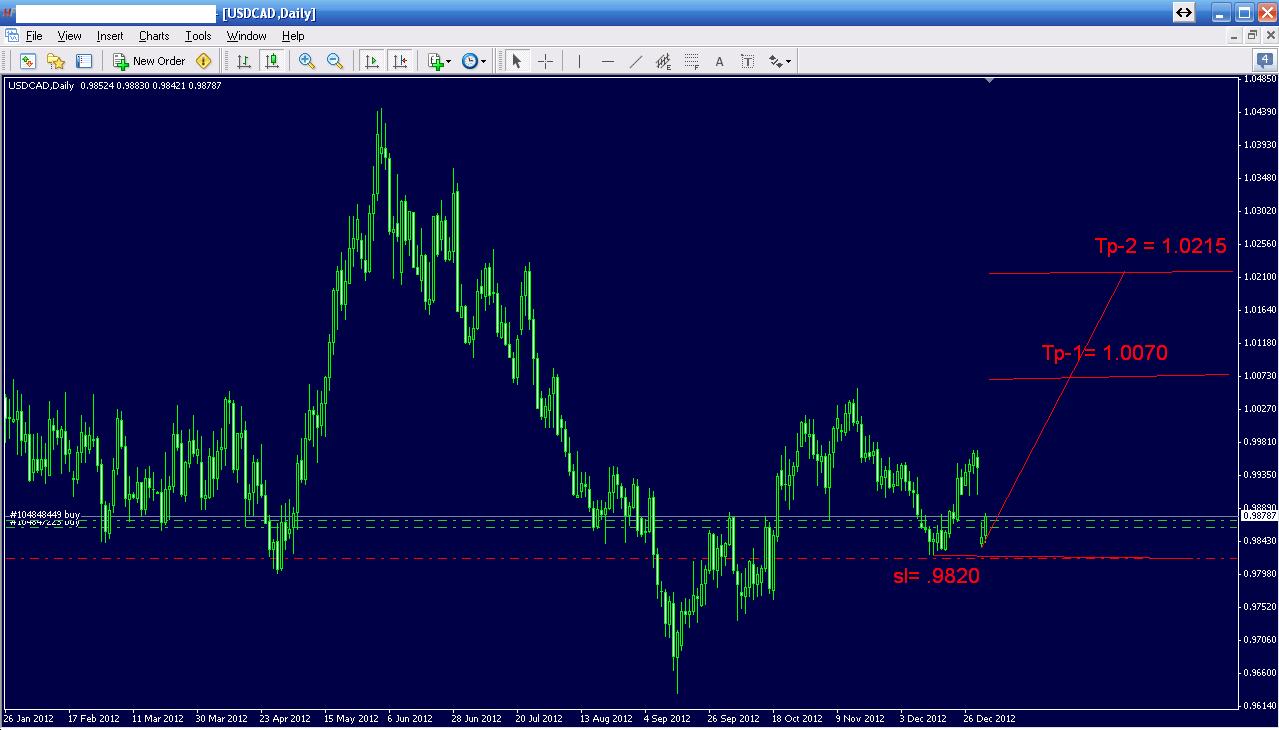
buy usd/cad at .9863, sl = .9820, tp-1= 1.0070, tp-2= 1.0215
Fichiers joints:
Membre depuis Aug 24, 2012
posts 138
Jan 03, 2013 at 21:30
(édité Jan 03, 2013 at 22:00)
merrygoround,
that was my second mistake to complete my strategy with a filter. you know i had enough equity to continue the trade
but my broker opened 20 hours late than other brokers at 2nd January that automatically hit my sl.
actually human learn from mistake.
now i have a good filter that tell me to avoid high risky trades.
Membre depuis Aug 24, 2012
posts 138
Jan 04, 2013 at 02:43
sell S&P 500 at 1457, sl= 1485, tp-1= 1340

Fichiers joints:
Jan 04, 2013 at 06:31
Its a pity you deleted your account history. I was following it with much interest as nobody on this entire site was able to provide strong argument proving that you were in wrong trade, and all your trading ideas looked so promising.
The market will go up, failing which, it will go down.
Membre depuis Aug 24, 2012
posts 138
Jan 04, 2013 at 07:41
wlk1 posted:
Its a pity you deleted your account history. I was following it with much interest as nobody on this entire site was able to provide strong argument proving that you were in wrong trade, and all your trading ideas looked so promising.
you can still view my account at
https://www.myfxbook.com/members/saeedrehman/saeed/452698
actually i had entered hotforex new feature "myhotforex". so
i created a new one.
Membre depuis Aug 24, 2012
posts 138
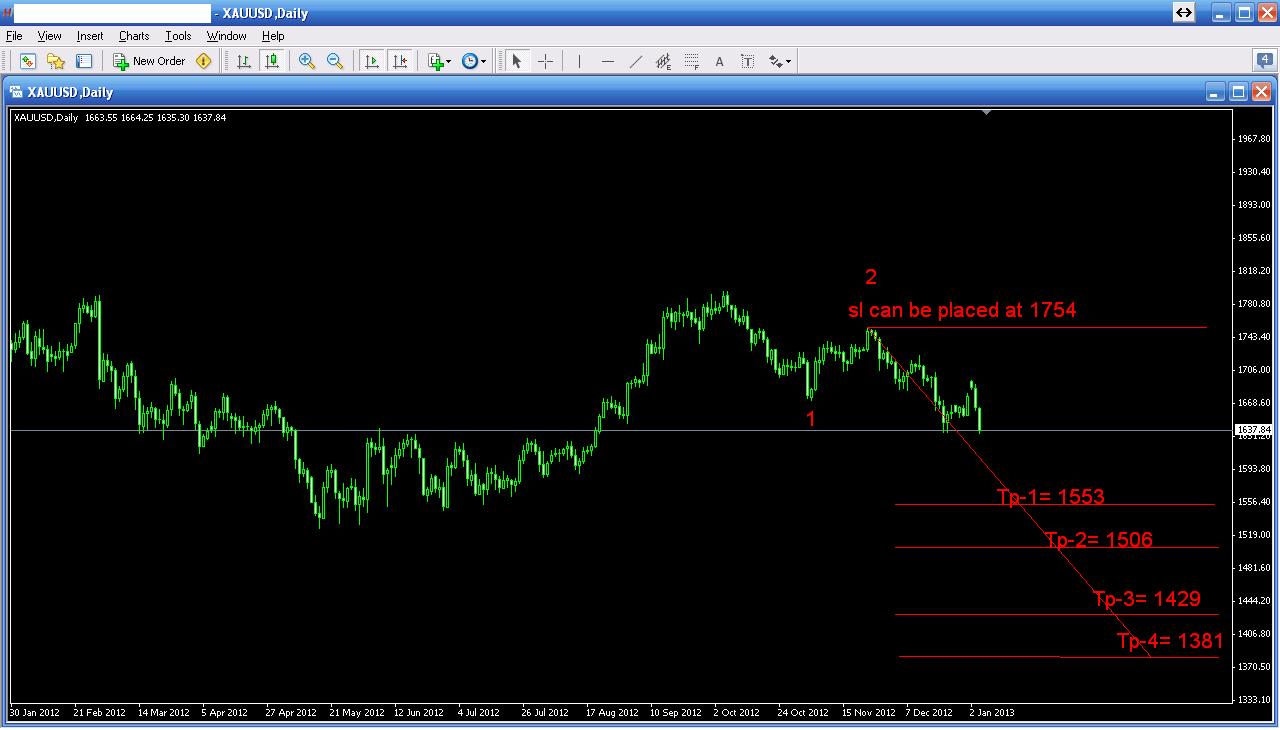
Jan 04, 2013 at 10:19
sell gold with sl= 1754, tp-1= 1553, tp-2= 1506, tp-3= 1429, tp-4= 1381
this is daily chart analysis. my last gold analysis was 4 hour chart that
is also attached with this picture.
this is daily chart analysis. my last gold analysis was 4 hour chart that
is also attached with this picture.
Fichiers joints:
Membre depuis Aug 24, 2012
posts 138
Jan 06, 2013 at 03:22
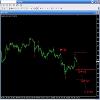
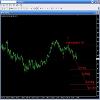
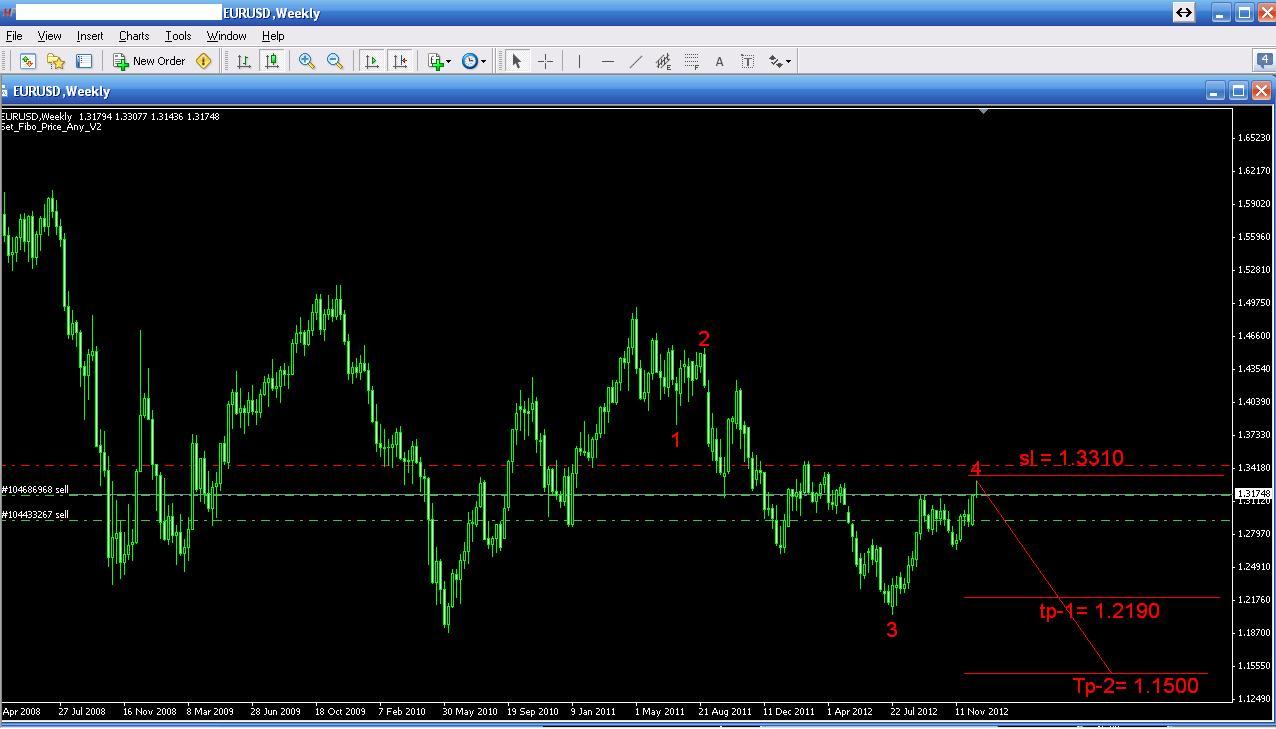
sell euro/usd near 1.3150, sl= 1.3260, tp-1= 1.2978, tp-2= 1.2850
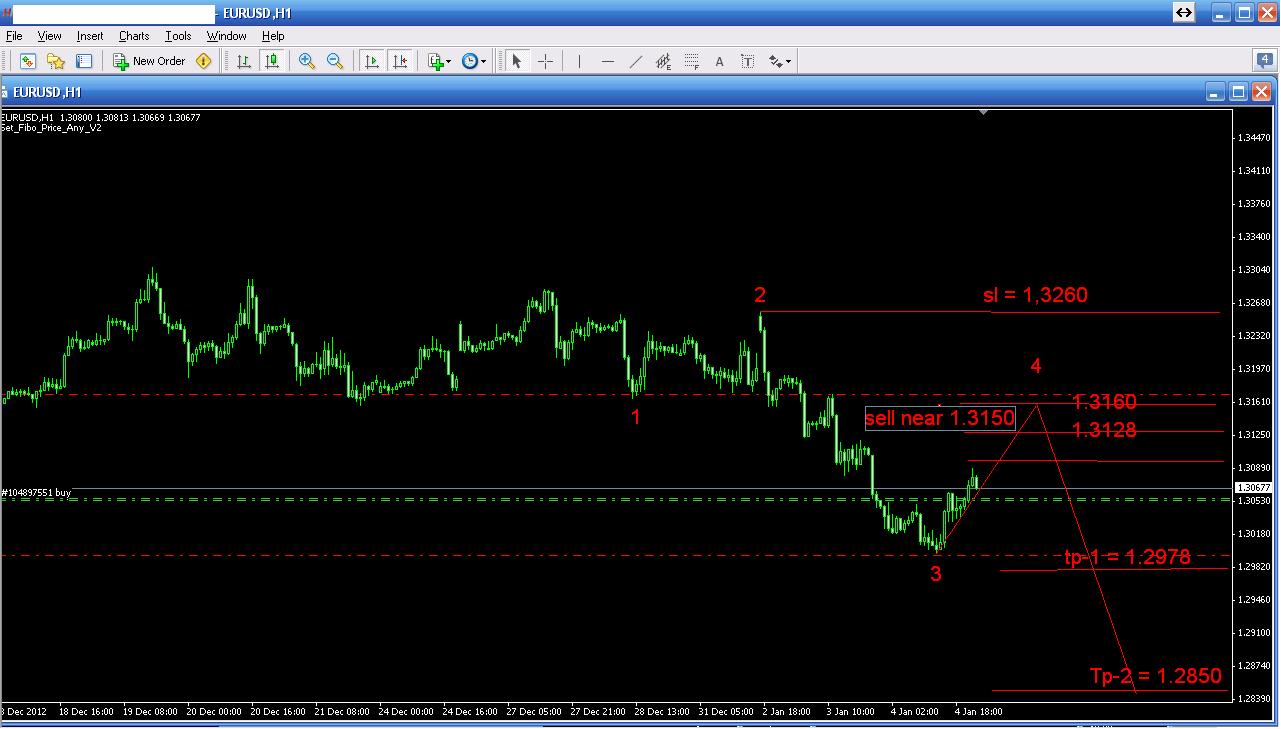
will follow weekly sell trend..........
will follow weekly sell trend..........
Fichiers joints:
Membre depuis Aug 24, 2012
posts 138
Jan 06, 2013 at 21:19
buy aud/cad at 1.0343, sl = 1.0260, tp-1= 1.0476, tp-2 = 1.0604

Fichiers joints:


