


Advertisement
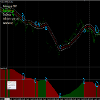
Does anyone know what indicator is this ?
Oct 24, 2014 at 14:56
Vues 2,412
19 Replies


Membre depuis Aug 19, 2013
posts 180
Nov 02, 2014 at 20:55
Attach the .mq4 file instead of the .ex4 file and I can help you.
Viva La Puerto Rico!

Nov 06, 2014 at 21:46
I guess it´s this one: https://www.premiumfxscalper.com/

Membre depuis Nov 21, 2011
posts 1601
Nov 06, 2014 at 22:58
(édité Nov 06, 2014 at 23:02)
You can't get it.... this is an home made Indicator.
But you can call it with iCustom()
But you can call it with iCustom()

Membre depuis Nov 11, 2012
posts 253
Nov 07, 2014 at 00:37
Ha ha I like their catchline "simply know every future movements IN ADVANCE" LOL
antariks1@


forex_trader_100706
Membre depuis Nov 26, 2012
posts 72
Nov 14, 2014 at 06:02
takechance posted:
Ha ha I like their catchline "simply know every future movements IN ADVANCE" LOL
If the indicator worked thoroughly, I think it would be automated into a complete strategy. Having a powerful indicator is just one ingredient.

Nov 14, 2014 at 23:47
FXdome posted:
Hi,
I am trying to find out what indicator this is from. I want to add this to an EA but not sure what it is. I attached the file here. Thanks
Hi FXdome
It's nothing special about this indicator (moving avegare), only visual representation is nicely done for manual trading.
you don't need this indicator, you can easily incorporte in your EA, it's simple moving average an offset about 100pips...see my pic
Fichiers joints:
Less is more.
Nov 15, 2014 at 15:00
Hi Aladar,
Thanks for figuring it out. I notice the lines on the graph but I am not sure what the setting on the MA would be. Can you give the details for that. Also when you said the offset about 100 pips, what does that mean ?
Thanks for figuring it out. I notice the lines on the graph but I am not sure what the setting on the MA would be. Can you give the details for that. Also when you said the offset about 100 pips, what does that mean ?
Live Freely
Nov 15, 2014 at 21:02
What you see on chart is :
Red line is moving average, simple, HL/2, periods 24 and 2 grey lines above/below are two levels for moving average. I think that crossing levels is the trigger for Buy/Sell. I did +100pips and -100pips as example, I believe/hope that 100pips is not constant value it may vary based on pair or it just simple an average height of the bars, which is easy to calculate in EA.
cheers
A.
Less is more.

forex_trader_43716
Membre depuis Aug 06, 2011
posts 326
Jan 31, 2015 at 07:25
takechance posted:
Ha ha I like their catchline "simply know every future movements IN ADVANCE" LOL
😎


*Lutilisation commerciale et le spam ne seront pas tolérés et peuvent entraîner la fermeture du compte.
Conseil : Poster une image/une url YouTube sera automatiquement intégrée dans votre message!
Conseil : Tapez le signe @ pour compléter automatiquement un nom dutilisateur participant à cette discussion.


