Edit Your Comment
EMA Crossover Indicator that works?
會員從Jul 01, 2015開始
46帖子
Oct 06, 2017 at 09:39
會員從Jul 01, 2015開始
46帖子
I was curious if anyone has or knows where to get an EMA Crossover Indicator that actually works. What I mean by that is I have found many but after added to a chart for some time they always add extra arrows and send extra notifications that are false. They have always been accurate when you first add them or even reset them, but sure enough they always mess up. Please let me know. Thanks
會員從Jul 01, 2015開始
46帖子
Nov 05, 2017 at 07:26
會員從Jul 01, 2015開始
46帖子
On the contrary, indicator trading can be extremely profitable as long as the indicator does not repaint and you learn how the indicator operates. I myself have tested many different EMA crossover indicators and all of which actually repaint and send false notifications. I have found one that works incredibly well for me and does not repaint(however it does still send false notification which I have learned to read) and have learned how to incorporate it into my trading. EMA crossover strategies do work, but you have to make them work for yourself rather than having someone tell you how to trade it. That's the start, now it's up to you to adapt it to your liking and trading style. With this being said, news does play a big part in trading but you will notice that the market will move long before that news ever comes out giving you an edge. It's all about being able to makes sense of charts and indicators while in turn having an eye on the big news events.
會員從Aug 27, 2017開始
875帖子
會員從Jul 01, 2015開始
46帖子
Nov 30, 2017 at 08:03
會員從Jul 01, 2015開始
46帖子
For me the EMA crossover strategy has worked out incredibly well. So much as in when I didn't trust it I actually lost a nice chunk of change. I've learned to get it back and am slowly working towards that now. There are many strategies that work for a lot of people that don't work for others. You simply have to make the strategy work for your style of trading and yes, parameters will play a huge part in your results differing from someone else's.
Nov 30, 2017 at 13:49
會員從Jun 14, 2013開始
127帖子
FXTrader1983 posted:
I was curious if anyone has or knows where to get an EMA Crossover Indicator that actually works. What I mean by that is I have found many but after added to a chart for some time they always add extra arrows and send extra notifications that are false. They have always been accurate when you first add them or even reset them, but sure enough they always mess up. Please let me know. Thanks
Hi, I agree with most people here. Using only one or more indicators to base your trading strategy on will never work in the long run. Markets tend to spend around 70-80% of the time trading sideways. Almost any indicator will give you false signals when the market is consolidating.
The most reliable method to determine entry and exit points for your trades is to use key support/resistance levels on higher time-frames. I use the daily charts to identify major support/resistance levels and wait until the market reaches these levels. I would then look at a lower time-frame, like the 1 Hour or 30 Minute charts to look for specific entry signals, using price action patterns like Candlestick Formation (Evening Star, Hammer, Etc.), Fibo levels, etc. Once I determined what price action is doing around these key levels, I look at the RSI and MACD levels to confirm my entry/exit.
The above explanation is very simplified, but I hope it gives you an idea of how you incorporate indicators in your trading. All indicators are lagging, and by themselves they will give you false and late signals. You should use them only (if al all) to confirm your entries/exits, but never base your trading decisions purely on indicators.
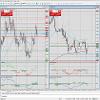
I added a screenshot of how my trade setup looks. I wrote my own indicator to show me when market are trading sideways, and also show me support/resistance levels above and below the market to use as target levels. You will see moving averages, RSI and MACD as well. Like I said, these are there for information only to conform my trade decisions.
Hope this helps. Good luck!
Keep it simple, be disciplined, get rich slowly and above all protect your equity!

*商業用途和垃圾郵件將不被容忍,並可能導致帳戶終止。
提示:發佈圖片/YouTube網址會自動嵌入到您的帖子中!
提示:鍵入@符號,自動完成參與此討論的用戶名。


