


XAUUSD Elliottwave Analysis
Mar 19, 2018 at 07:58
458 視聴
1 Replies

Feb 11, 2018からメンバー
232 投稿
Mar 19, 2018 at 07:58
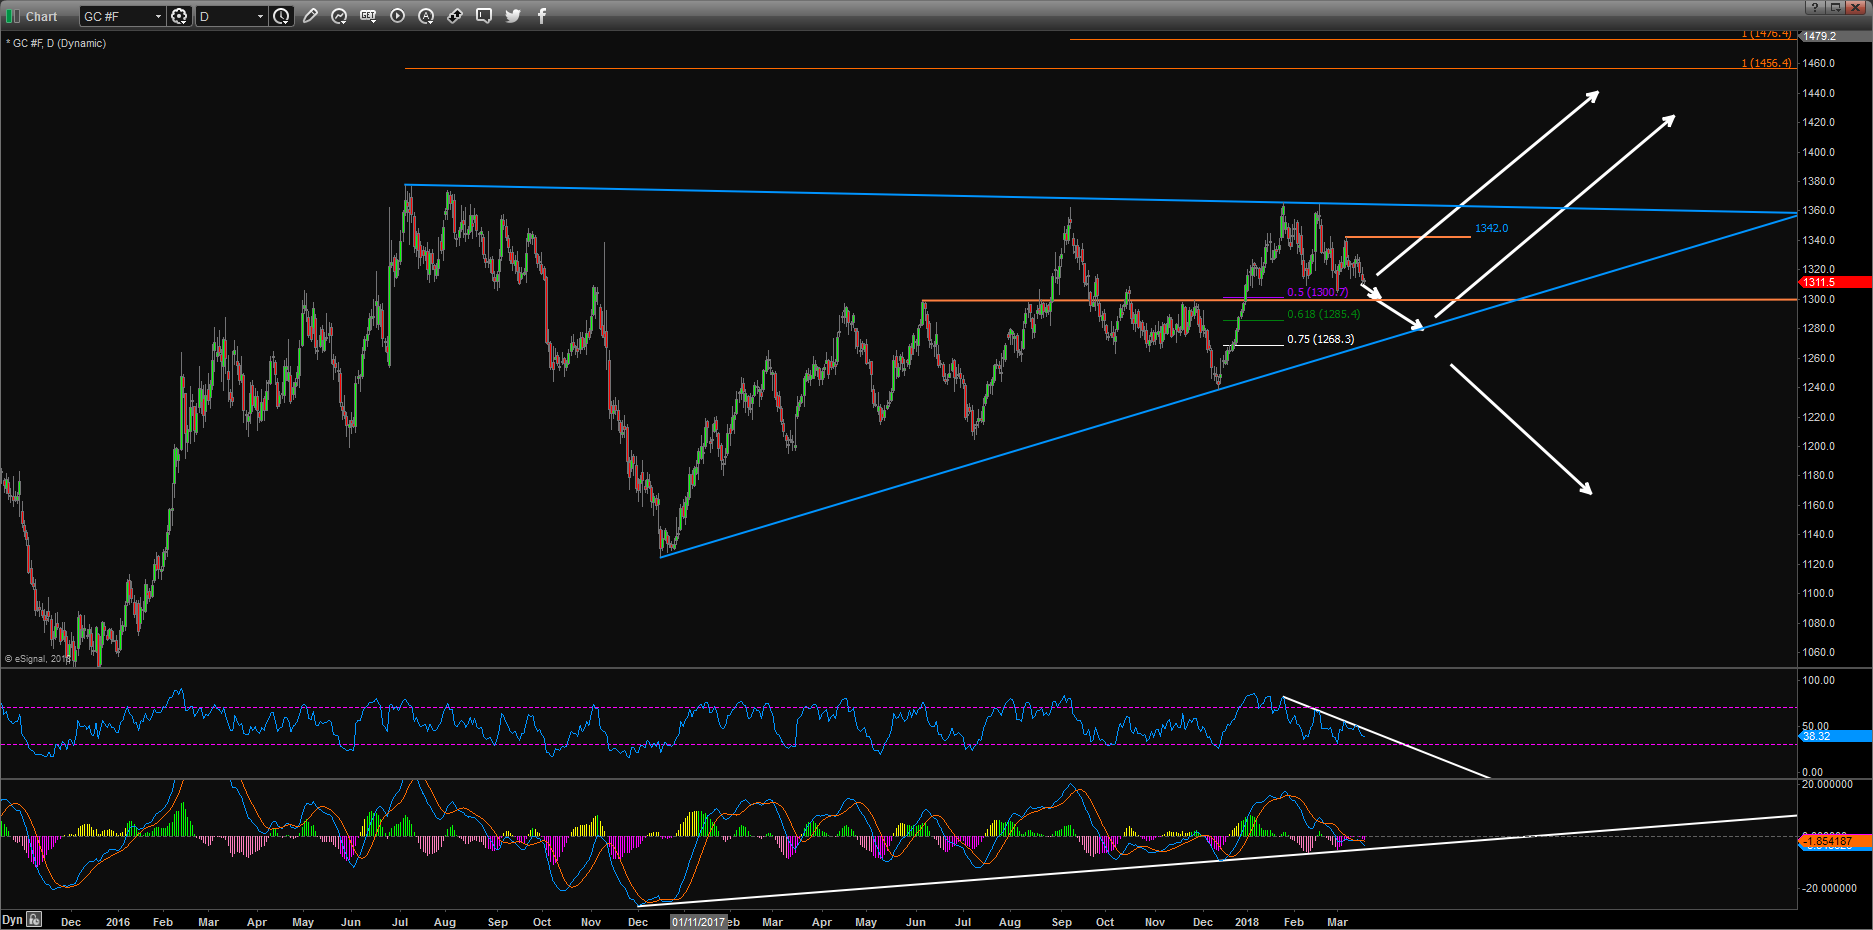
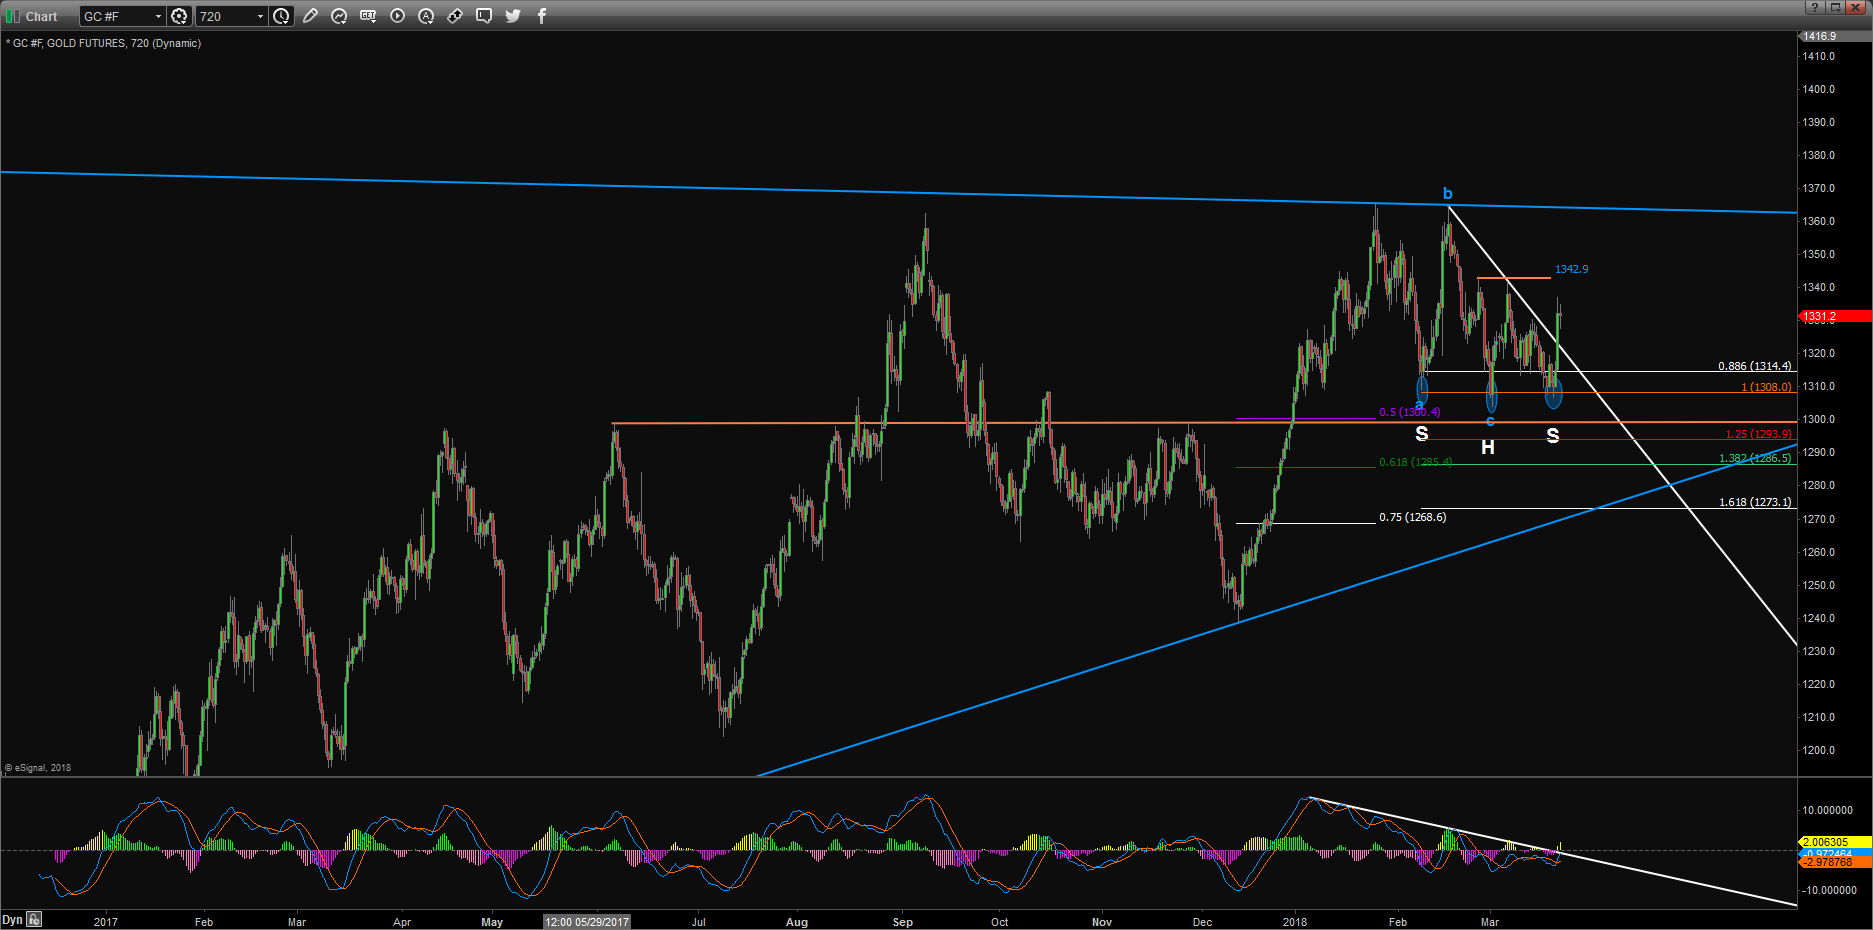
On daily chart, we still suspect spot Gold in a potential triangle consolidate mode.
Short term neutral bias within 1300/42 range.
Need to break either side to provide clearer direction.
Below 1300/1299.6, will expose 1277/1267 support zone.
Above 1342 may directly bullish for 1355/1372, 1396.
(views are my own, not trading recommendations. Good Luck!)
Short term neutral bias within 1300/42 range.
Need to break either side to provide clearer direction.
Below 1300/1299.6, will expose 1277/1267 support zone.
Above 1342 may directly bullish for 1355/1372, 1396.
(views are my own, not trading recommendations. Good Luck!)
付属品:

*商用利用やスパムは容認されていないので、アカウントが停止される可能性があります。
ヒント:画像/YouTubeのURLを投稿すると自動的に埋め込まれます!
ヒント:この討論に参加しているユーザー名をオートコンプリートするには、@記号を入力します。


