


EUR/GBP

Sep 12, 2015からメンバー
1948 投稿
Mar 31, 2017 at 13:55
Yeah I always have tight stops it place 2% at most, I was away for Lunch ,good thing I had my stop in place.
"They mistook leverage with genius".
Sep 12, 2015からメンバー
1948 投稿
Apr 01, 2017 at 16:32
Yeah you can look for other opportunities once you have your stop loss in place and you know exactly how much your willing to lose ,if it goes against you. I know some traders that trade without stop losses ,sometimes you can be very lucky and it will pull back if your entry is close to equilibrium ,unfortunately what we think is the right price isn't always what the banks think. If your looking to build wealth best to keep losses small.
"They mistook leverage with genius".
Apr 02, 2017 at 11:15
snapdragon1970 posted:
Yeah you can look for other opportunities once you have your stop loss in place and you know exactly how much your willing to lose ,if it goes against you. I know some traders that trade without stop losses ,sometimes you can be very lucky and it will pull back if your entry is close to equilibrium ,unfortunately what we think is the right price isn't always what the banks think. If your looking to build wealth best to keep losses small.
I couldn't agree more. Trading without a SL has always seemed like such an unnecessary risk to me. Unexpected spikes and pullbacks are always possible, often they're large enough to cause serious trouble if you don't have a SL set.
Sep 12, 2015からメンバー
1948 投稿
Apr 02, 2017 at 12:04
I was always taught to trade spikes on extremes or on pullbacks ,wait for them to occur then go long or short, BB is a useful indicator for this kind of trading, there is a good method for not getting caught out most of the time.
"They mistook leverage with genius".

forex_trader_338100
Jun 21, 2016からメンバー
898 投稿
Apr 02, 2017 at 13:46
Soon the election in France and Germany, now he is talking about Frexit😕
Sep 12, 2015からメンバー
1948 投稿
Apr 02, 2017 at 17:24
besttools posted:
Soon the election in France and Germany, now he is talking about Frexit😕
Le Pen will never get to run France, too much opposition.
"They mistook leverage with genius".
Apr 03, 2017 at 07:27
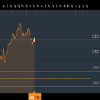
The three-day losing streak in the EUR/GBP appears to have come to a halt this Monday morning in Asia.
The cross was last seen trading around 0.8513 handle. The UK manufacturing number due later today is expected to show the pace of expansion in the activity ticked higher to 55.1 in March from the Feb figure of 54.6.
Currently, EUR/GBP is trading at 0.85075, up + 0.26%, having posted a daily high at 0.85214 and low at 0.84897.
EUR/GBP Technical Levels:
A break above 0.8555 (100-DMA) would expose 0.8582 (50-DMA + 5-DMA) and 0.86 (zero figure). On the other hand, a breakdown of support at 0.8485 (Friday’s low) would open doors for a sell-off to 0.8450 (Feb 13 low) and 0.8422 (Feb 23 low).
TREND INDEX:
Bullish
AVG SELL PRICE:
0.0000
AVG BUY PRICE:
0.8623
RECOMMENDATION:
BUY
付属品:
Sep 12, 2015からメンバー
1948 投稿
Apr 03, 2017 at 10:45
I took a quick Long at the open last night and closed out at 1.25, it has retested the 85100 level which to me is a bullish sign ,I'm Long until I see weakness.
"They mistook leverage with genius".
Sep 12, 2015からメンバー
1948 投稿
Apr 03, 2017 at 12:48
That's a logical trade you did, just need to break 85400 last high 85350.
"They mistook leverage with genius".
Sep 12, 2015からメンバー
1948 投稿
Apr 04, 2017 at 05:57
Early move on Eur/gbp
"They mistook leverage with genius".
Sep 12, 2015からメンバー
1948 投稿
Apr 04, 2017 at 22:28
86200 looks favourable ,so much for all the negative posts for Euro.
"They mistook leverage with genius".

Sep 12, 2015からメンバー
1948 投稿
Apr 05, 2017 at 09:45
Nice short trade over night ,see some support at 85400 to take it back up to 85900 ceiling.
"They mistook leverage with genius".
forex_trader_338100
Jun 21, 2016からメンバー
898 投稿
Apr 06, 2017 at 13:24
Momentum above 0.8570 level could get extended towards 0.8595-0.8600 region (200-day SMA), above which a bout of short-covering has the potential to lift the cross back towards mid-0.8600s horizontal hurdle. On the downside, 0.8540 level now becomes immediate support, which if broken is likely to accelerate the slide back towards the 0.85 handle, en-route 0.8480-75 support area.
Sep 12, 2015からメンバー
1948 投稿
Apr 07, 2017 at 10:50
Went Long on EUR/GBP this morning helped by the negative data out of the UK, we are beginning to see how weak pound is on any negative Data.
"They mistook leverage with genius".


