


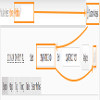
VestigeUSD (による VestigeTA)
| 増加 : | +182.15% |
| ドローダウン | 14.79% |
| ピップス: | 553764.3 |
| 取引 | 129 |
| 勝利: |
|
| 負け: |
|
| タイプ: | リアル |
| レバレッジ: | 1:100 |
| 取引: | 手動 |
VestigeUSD 討論
May 25, 2020 at 12:45
248 視聴
1 Replies

May 25, 2020 at 21:53
Why does it show like this? it gained in the past 450+ and lost on a bad expert advisor and now it show like this but the profit in money is more,does anyone have any idea if it can be set to show only starting past 5 month or so?
Get rich or die trying :@


*商用利用やスパムは容認されていないので、アカウントが停止される可能性があります。
ヒント:画像/YouTubeのURLを投稿すると自動的に埋め込まれます!
ヒント:この討論に参加しているユーザー名をオートコンプリートするには、@記号を入力します。


