


Advertisement
Bitcoin (BTC) analysis thread

Mar 18, 2019 부터 멤버
게시물97
Jul 17, 2020 at 10:49
good stuff bro. bitcoin relatively stale right now. will chart over weekend and see.

Apr 09, 2019 부터 멤버
게시물516
Jul 17, 2020 at 14:46
BTC looking dull at the moment, hopefully just winding up to pop
If you can't spot the liquidity then you are the liquidity.
Jul 09, 2019 부터 멤버
게시물37
Jul 21, 2020 at 10:49
sebking1986 posted:
BTC looking dull at the moment, hopefully just winding up to pop
True. When do you guys think it will reach $10000 again?

Jul 25, 2020 at 12:06

Hi all.
At last some activity for Bitcoin this week. Not much but for now it`s very bullish.
Actual PA situation:
1. At last the price significantly broke the upper side of the 3 years symmetrical triangle. If we close this week at this level the whole candle will be above this triangle which will be super.
2. 10 EMA – the price is perfectly bouncing from it again.
3. 21 EMA - the price is still above it even without a touch of it.
4. Correlation between 10 and 21 EMA – Despite the Corona drop every time when the 10 EMA is above the 21 EMA and the price is above both we can predict a very good bull period.
5. Parabolic SAR – Another bullish week and there`s 13 weeks bullish signaling.
6. Weekly pivot point is $9196.56. We`re far from it so far, so I can say that next week can be positive too.
7. Support and resistance:
7.1. Support:
1st support - $8500 - 50% Fibo and VPVR profile
2nd support - $7800
7.2. Resistance:
1st resistance - $9500-9800
2nd resistance - $10500 – that will be a MAJOR resistance not only for the mid-term but also in a long-term, on the way to the next ATH like mentioned above.
8. Like I told you last week the BTC volatility is very low. Under 40 actually. Like you`ll see from the chart, every time when this happened it`s followed by a significant move soon after it. Despite the corona drop, last such low was before the 14K run last summer.
All this points are 100% bullish and seems like Plan A is in play.
P.S. The 4th Golden gross on a 2D chart into a Bitcoin history is already a fact!
That`s all for now.
See ya next time.
첨부 파일:
momchil_slavov@
Mar 18, 2019 부터 멤버
게시물97
Jul 25, 2020 at 19:03
lavis_book posted:sebking1986 posted:
BTC looking dull at the moment, hopefully just winding up to pop
True. When do you guys think it will reach $10000 again?
i def think we will see 10k this year again.
Apr 09, 2019 부터 멤버
게시물516
Jul 27, 2020 at 10:39
Moving very quickly these past few days! Full expect a retrace at some point but hopefully not right back to 9k again.
If you can't spot the liquidity then you are the liquidity.
Aug 02, 2020 at 11:55
Hi all.
What a week for Bitcoin right? Like I’m repeating you last weeks it was imminent to see such movement.
Before the actual price action, I want to summarize the week into a couple of words.
First, we broke the 3 years symmetrical triangle at last and we did it with a significant volume. Till this night drop I was a bit concerned cuz we literally skyrocketed and like I’ve told you in the past, such movement without a correction is not healthy. At second point let`s get to this night drop. Yes, it was significant but for me it`s actually a perfectly bullish. Why? You`ll see from the price action below.
Actual PA situation:
Support and resistance:
Support:
1st support - $10500 – last MAJOR resistance. This support has been tested already with this night drop and done it`s job perfectly. That`s why I’m bullish about this drop.
2nd support - $9000
Resistance:
1st resistance - $12500 – almost the last bigger resistance before the clear skies, accordingly to VPVR.
2nd resistance - $14000 – the last resistance before the 20K test I can say (the last top + VPVR).
Somewhere between 1st and 2nd resistance is $10K, which can act as a support too cuz of the psychological level.
10 EMA – the price is still above it even without a touch of it.
21 EMA - the price is still above it even without a touch of it.
Correlation between 10 and 21 EMA – Despite the Corona drop every time when the 10 EMA is above the 21 EMA and the price is above both we can predict a very good bull period.
Parabolic SAR – Another bullish week and there`s 14 weeks bullish signaling.
Weekly pivot point is $9757.62. We`re far from it so far, so I can say that next week can be positive too.
BTC volatility is still under 40 actually so more movements can be expected.
That`s all for now. Not much may be, but I think it`s explaining the actual situation. Next week i`ll try to go deeper.
See ya next time.
첨부 파일:
momchil_slavov@
Apr 09, 2019 부터 멤버
게시물516
Aug 03, 2020 at 14:04
Good stuff bud! Hopefully we see continuation to the upside this week!
If you can't spot the liquidity then you are the liquidity.
Aug 08, 2020 at 15:58
Hi all.
Well, nothing major happened this week for me and despite the very good green candle, which is forming, there`s nothing more to say about the PA. Other than that, there`s something very good and major happened with Bitcoin but you`ll see it from the second chart.
Actual PA situation (chart 1):
1. Support and resistance:
1.1. Support:
1st support - $10500 – last MAJOR resistance. This support has been tested already with this night drop and done it`s job perfectly. That`s why I’m bullish about this drop.
2nd support - $9000
1.2. Resistance:
1st resistance - $12500 – almost the last bigger resistance before the clear skies, accordingly to VPVR.
2nd resistance - $14000 – the last resistance before the 20K test I can say (the last top + VPVR).
Somewhere between 1st and 2nd resistance is $10K, which can act as a support too cuz of the psychological level.
2. 10 EMA – the price is still above it even without a touch of it.
3. 21 EMA - the price is still above it even without a touch of it.
4. Correlation between 10 and 21 EMA – Despite the Corona drop every time when the 10 EMA is above the 21 EMA and the price is above both we can predict a very good bull period.
5. Parabolic SAR – Another bullish week and there`s 15 weeks bullish signaling.
6. Weekly pivot point is $11035.14. We`re far from it so far, so I can say that next week can be positive too.
7. BTC volatility is still under 40 actually so more movements can be expected. We`ve saw only a small part till now.
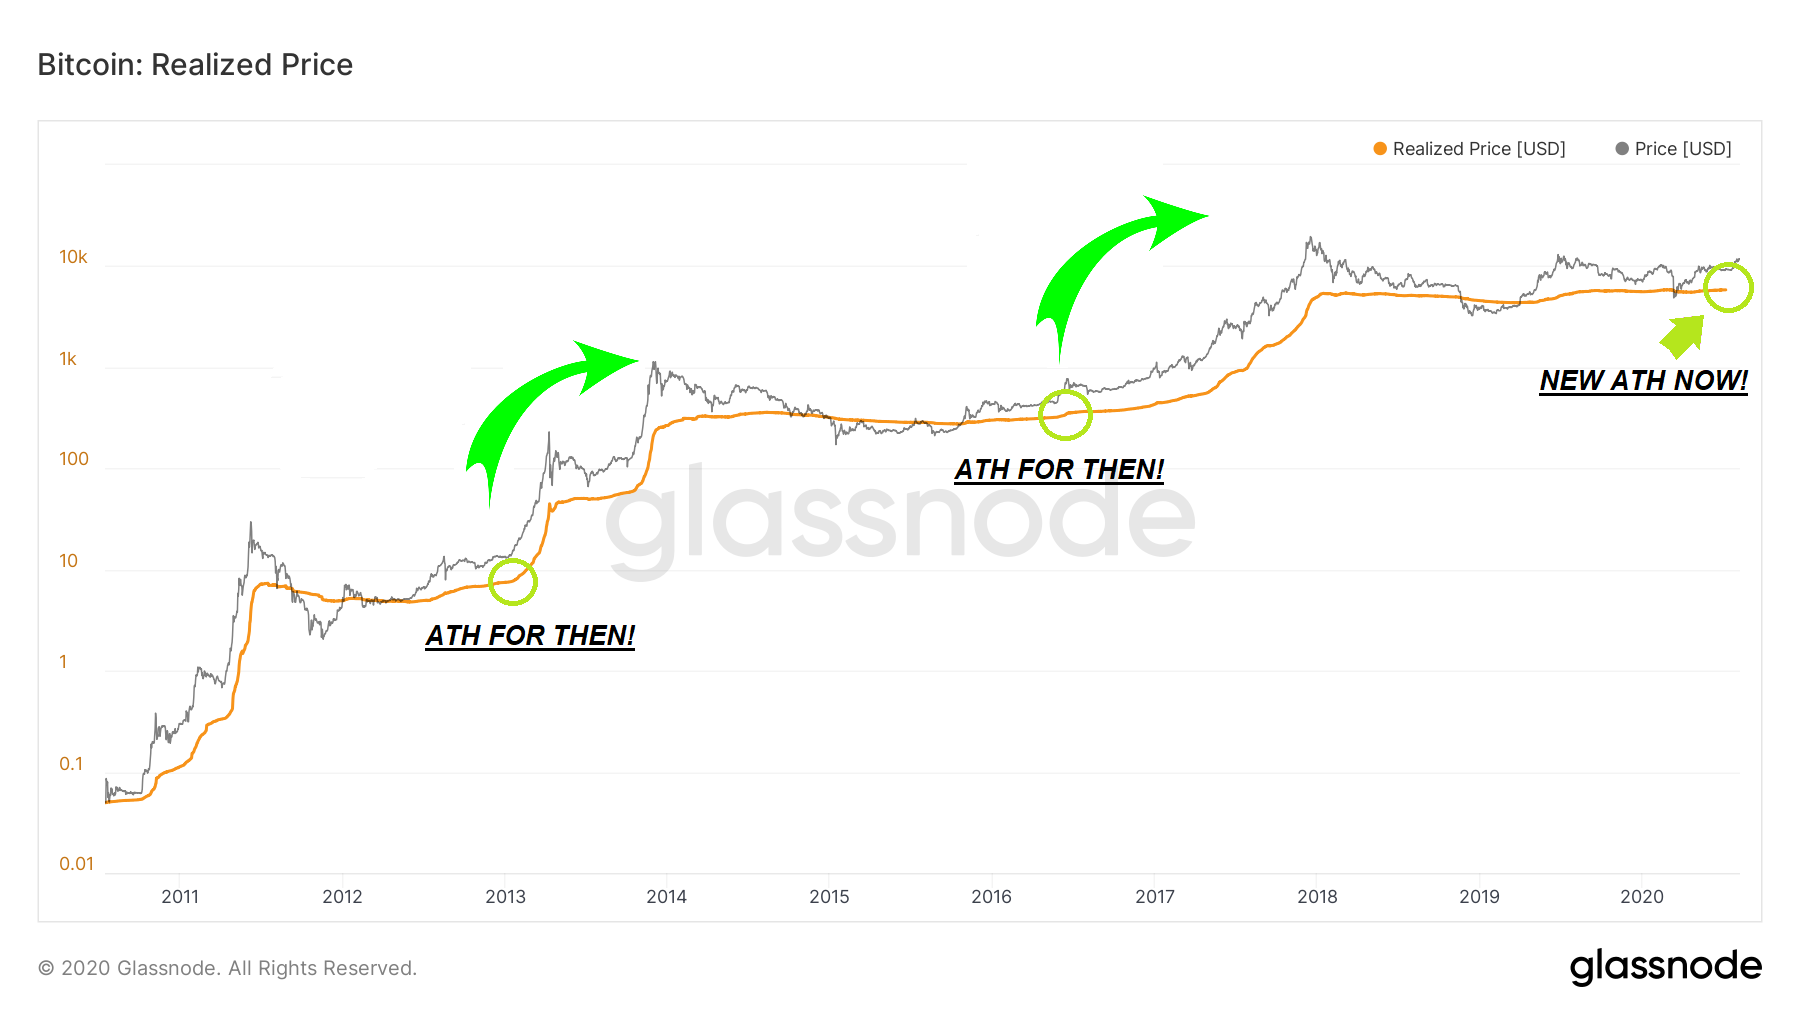
Bitcoin Realized price (chart2):
Thanks to Glassnode again we can check the Bitcoin Realized price chart. It`s very simple and clear. The grey line is the BTC price. The orange line is Realized price. Realized Price is the Realized Cap divided by the current supply. Or simply said that`s the price of all BTC paid in circulation right now. This Realized price at the moment is around $6000 and even above, which is the new all time high (ATH). If we check back in the past, every time when we saw such ATH we`ve had a parabolic run and a new price ATH afterward. BUUULISH!!!
That`s all for now.
See ya next time.
첨부 파일:
momchil_slavov@
Apr 09, 2019 부터 멤버
게시물516
Aug 10, 2020 at 12:12
Certainly looks positive from the weekend. Hopefully it continues as per your analysis
If you can't spot the liquidity then you are the liquidity.
Mar 18, 2019 부터 멤버
게시물97
Aug 10, 2020 at 12:38
i think 12k may be approaching./
Aug 15, 2020 at 12:27
Hi all.
I`m very tired after this week so i`ll be very short but specific this time.
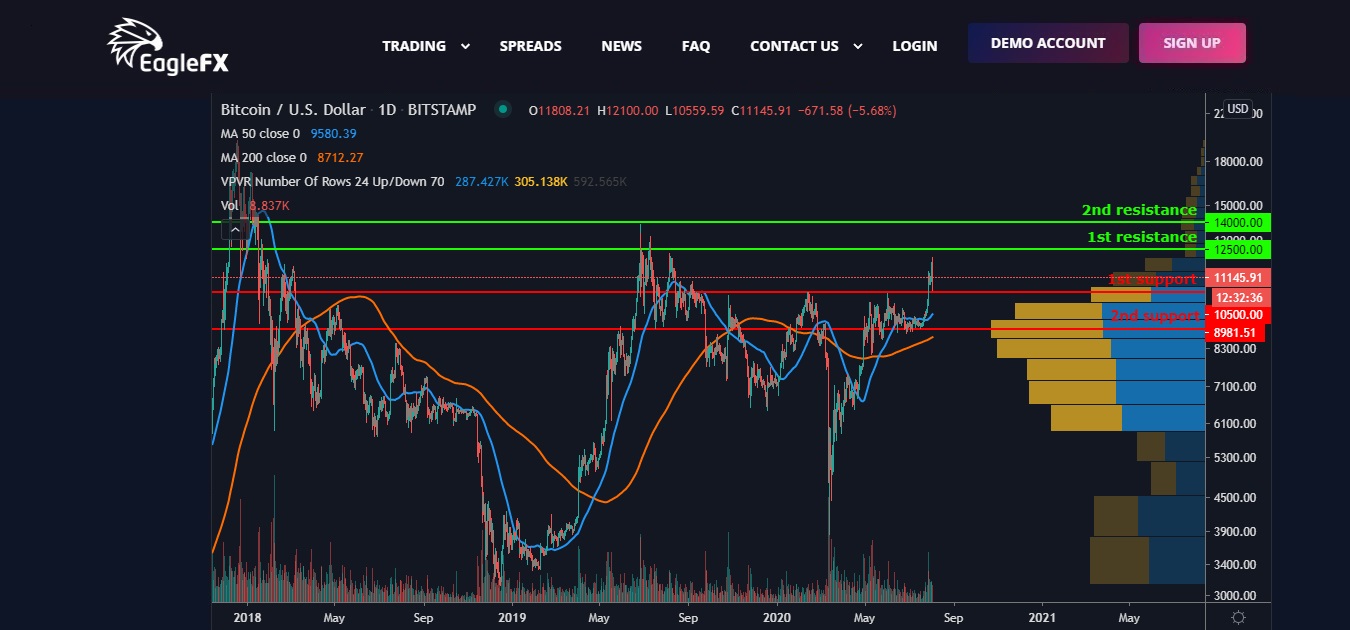
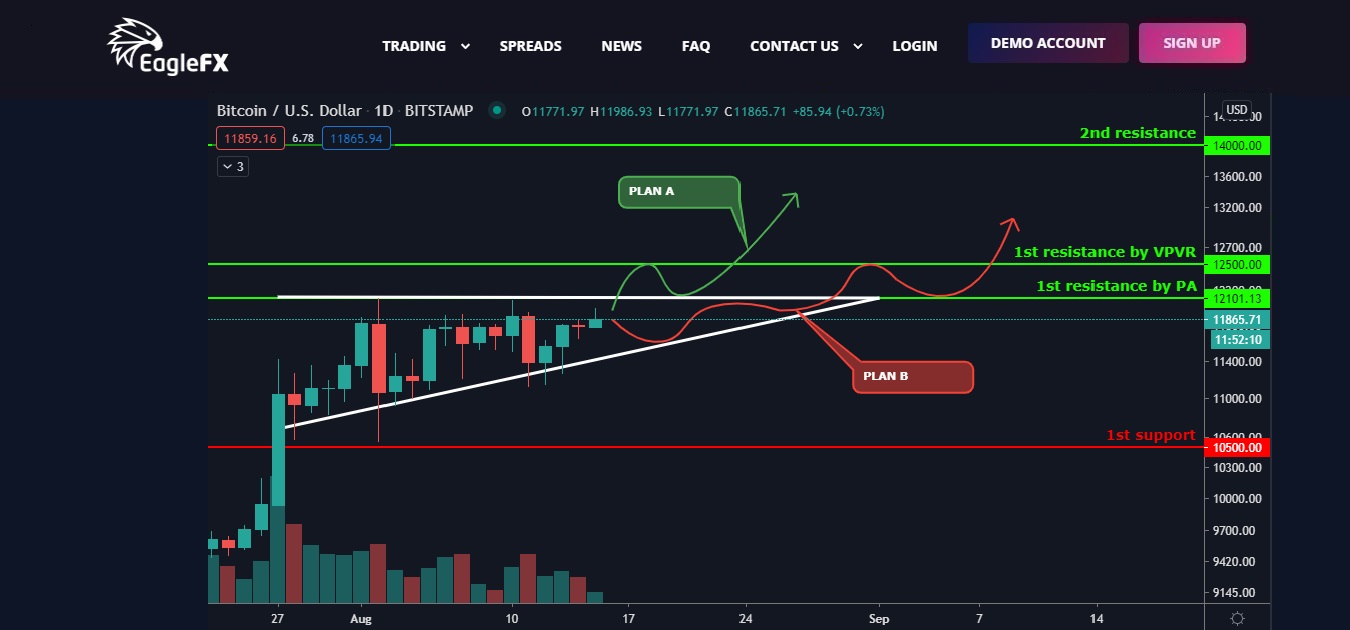
I`m switching to 1D chart this week and there`s an awesome ascending triangle. It`s almost the same in the 4H chart. The breaking of this triangle is imminent. No matter which plan will be fulfilled (A or B) there`s almost clear skies above the $12100-12500 level. I personally think that plan B will be fulfilled and this will happen at the end of this month or at the beginning of September lately (almost at the edge of this ascending triangle). The other needed rule to be this move not speculative is to see a significant volume when this happen. Even if there`s a breaking below this triangle (possible plan C), we`re fine till $10500 and the bull run can continue after this dip to $10500.
More of the actual PA below.
Actual PA situation:
1. Support and resistance:
1.1. Support:
1st support - $10500 – last MAJOR resistance. This support has been tested already with this night drop and done it`s job perfectly. That`s why I’m bullish about this drop.
2nd support - $9000
1.2. Resistance:
1st resistance - $12100-12500 – almost the last bigger resistance before the clear skies, accordingly to VPVR.
2nd resistance - $14000 – the last resistance before the 20K test I can say (the last top + VPVR).
Somewhere between 1st and 2nd resistance is $10K, which can act as a support too cuz of the psychological level.
2. 10 EMA – the price is still above it even without a touch of it.
3. 21 EMA - the price is still above it even without a touch of it.
4. Correlation between 10 and 21 EMA – Despite the Corona drop every time when the 10 EMA is above the 21 EMA and the price is above both we can predict a very good bull period.
5. Parabolic SAR – Another bullish week and there`s 16 weeks bullish signaling.
6. Weekly pivot point is $11512.10.
That`s all for now.
See ya next time.
첨부 파일:
momchil_slavov@
Apr 09, 2019 부터 멤버
게시물516
Aug 17, 2020 at 11:33
Still pushing for 12k so hopewfully we see it test that resistance in the week.
If you can't spot the liquidity then you are the liquidity.
Aug 22, 2020 at 19:54
Hi all.
Well, Bitcoin dropped 3% from the last week and around 7% from it`s high at the beginning of this one. Is it so bad? I don`t think so! Why? I`ll show you below so don`t freak out but zoom out.
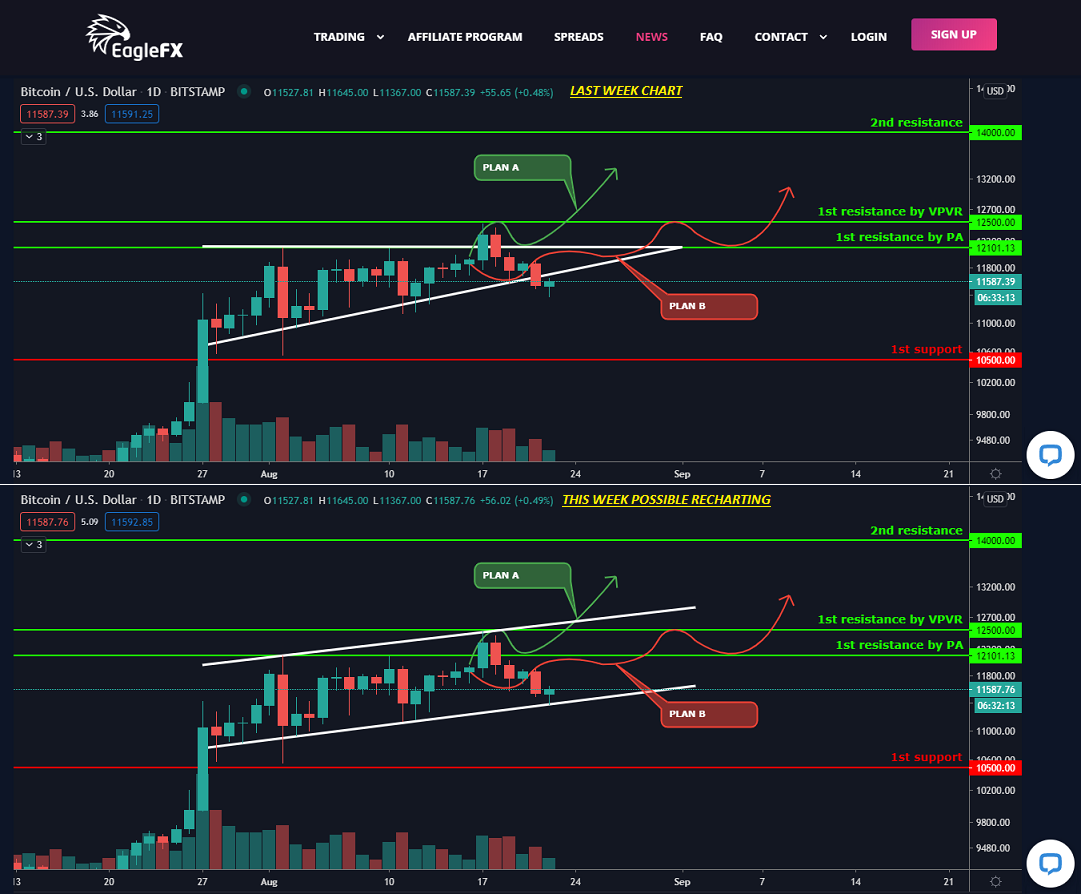
Last week daily chart VS this week possible re-charting (chart1)
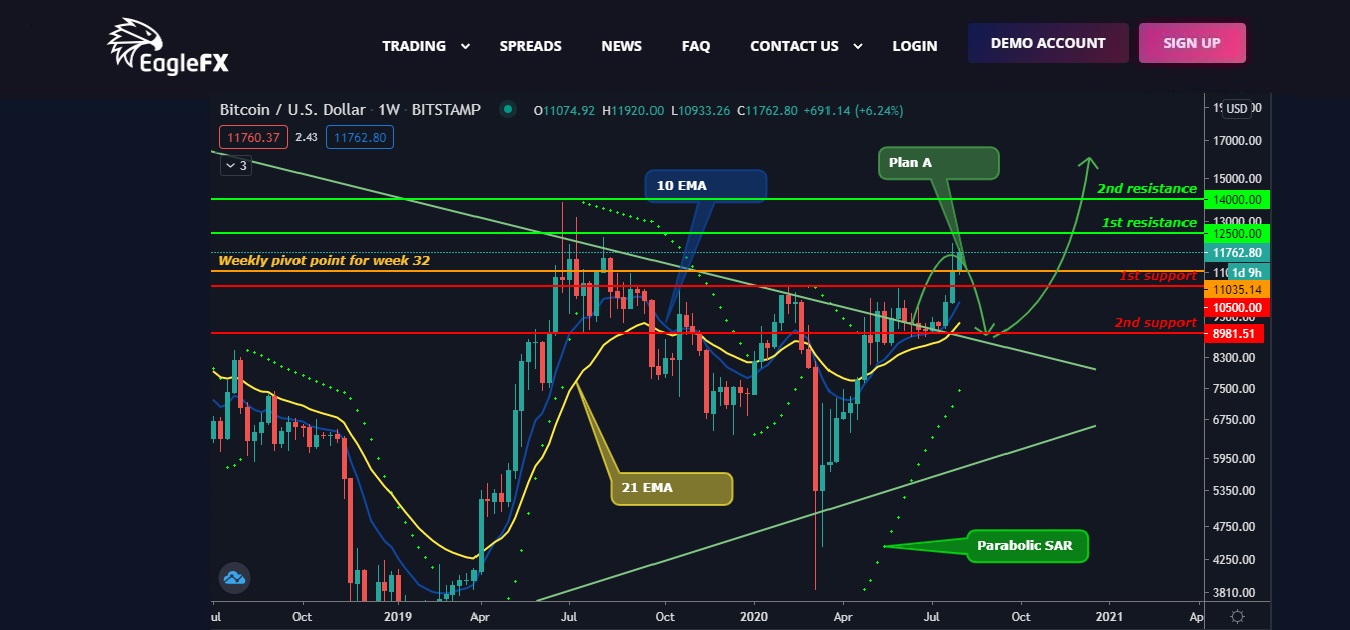
Last week I was talking about an ascending triangle and 2 (or even 3) possible scenarios. At the beginning of this week all seems like scenario A is in play until the decline that came from nowhere. My personal opinion is that both the peak to $12500 and the drop to $11400 are just a fake moves if we`re looking at this ascending triangle chart. That`s why i`ve tried to ignore it and search for another pattern and almost immediately I saw the ascending channel (trend). A perfect one. Which pattern from this 2 you`ll use is your decision but at this moment i`m 70:30 to the ascending channel (trend).
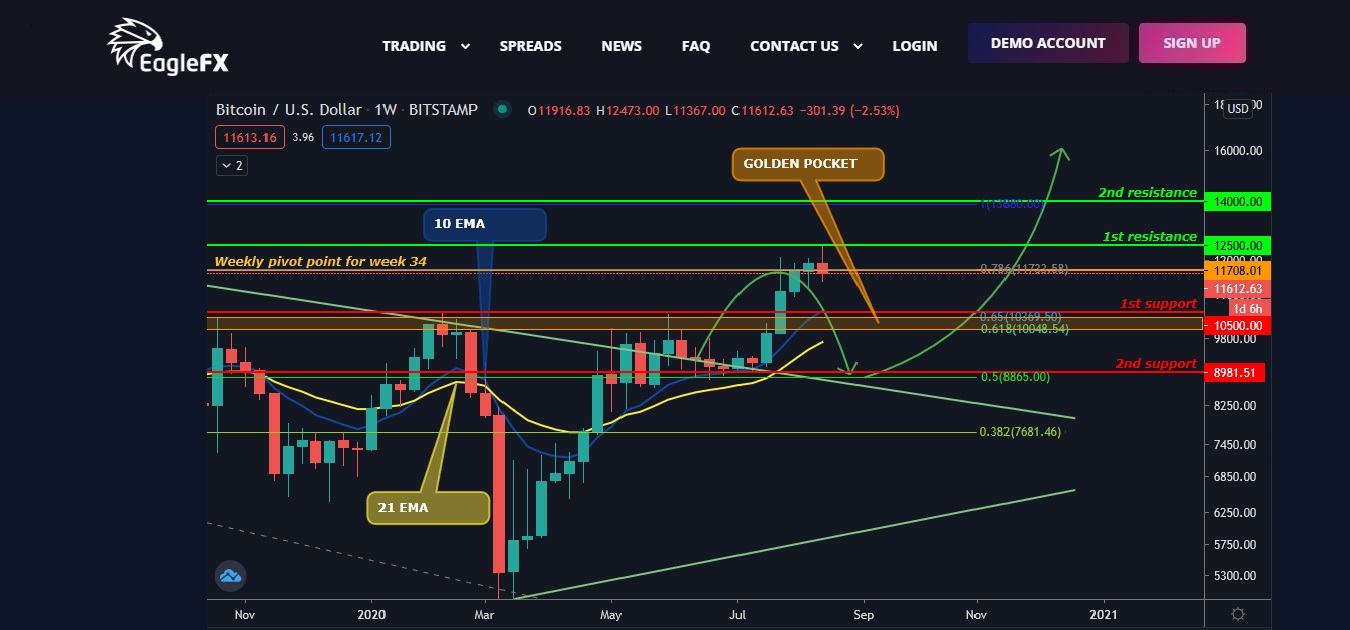
Weekly chart (chart 2)
Here are 2 things to say. The 1st one is that this chart was initially made at 28.06.2020. Look at the green arrows which are pointing the possible price move. Even I was surprised how accurate are they till now. The most important thing here is the newly added fibo retracement from the last summer 14K top to the corona drop to 3.8K this year. What can we see? A beautiful fibo golden pocket between 10K and 10.5K. This 10.5K sounds familiar right? So what`s the conclusion here? That`s even if we fall far below this ascending triangle or if we fall below this ascending channel, then we have a REALLY STRONG support at 10.5K and even a bit below this (around 10K).
Actual PA situation:
Support and resistance:
Support:
1st support - $10500 – last MAJOR resistance.
2nd support - $9000
Resistance:
1st resistance - $12100-12500 – almost the last bigger resistance before the clear skies, accordingly to VPVR. You saw where we stopped this week – exactly at $12500.
2nd resistance - $14000 – the last resistance before the 20K test I can say (the last top + VPVR). Somewhere between 1st and 2nd resistance is $10K, which can act as a support too cuz of the psychological level.
10 EMA – the price is still above it even without a touch of it.
21 EMA - the price is still above it even without a touch of it.
Correlation between 10 and 21 EMA – Despite the Corona drop every time when the 10 EMA is above the 21 EMA and the price is above both we can predict a very good bull period.
Parabolic SAR – Another bullish week and there`s 17 weeks bullish signaling (despite this week`s red candle for now).
Weekly pivot point is $11708,01.
That`s all for now and like i`ve said it before – these corrections are healthier than you think.
See ya next time.
첨부 파일:
momchil_slavov@


