


Advertisement
BBs and SMAs for M1 and M5 Charts
Apr 11, 2020 at 16:58
589 개의 뷰
1 Replies
Apr 11, 2020 at 16:58
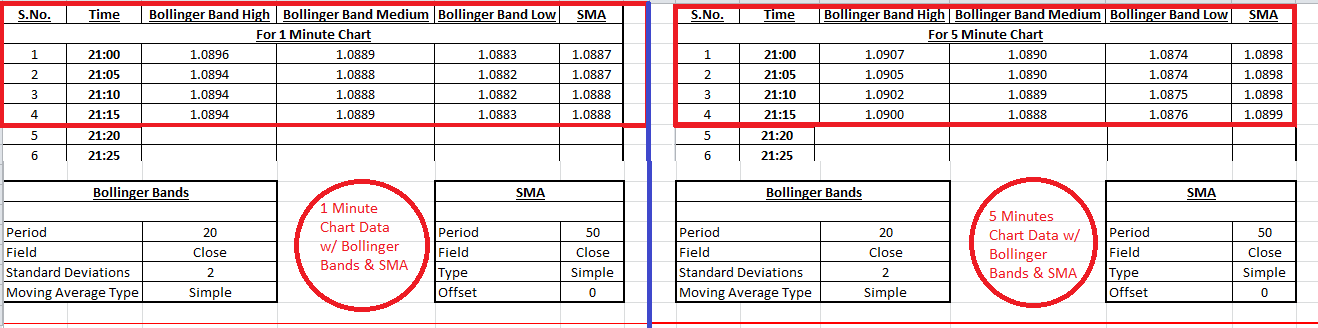
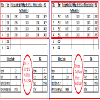
I am using Bollinger Bands and SMA Studies for the etoro Charts in 1 Min. & 5 Min. Time Frames..
But, what I want is to see is that I get the same Figures of the 2 Mentioned Studies (for the 1 & 5 minutes) in chosen time frames.
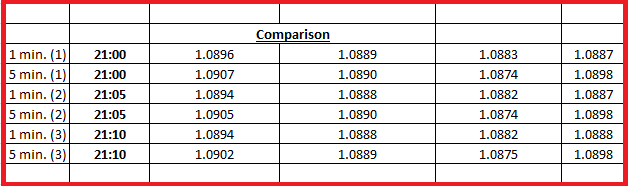
Example; For Instance, Choosing a Candlestick for time 21:00, then for a 1 min. chart, I should be able to see the same figures of Studies (B. Bands and SMAs) as for a 5min. chart with the same time unit (i.e. 21:00) (i.e. irrespective of the Size of the Candlesticks)..
To explain more , I am attaching the Screen shots I did for the 1 min. & 5 min. Charts at different times..
Along with the study tools details I used for it.
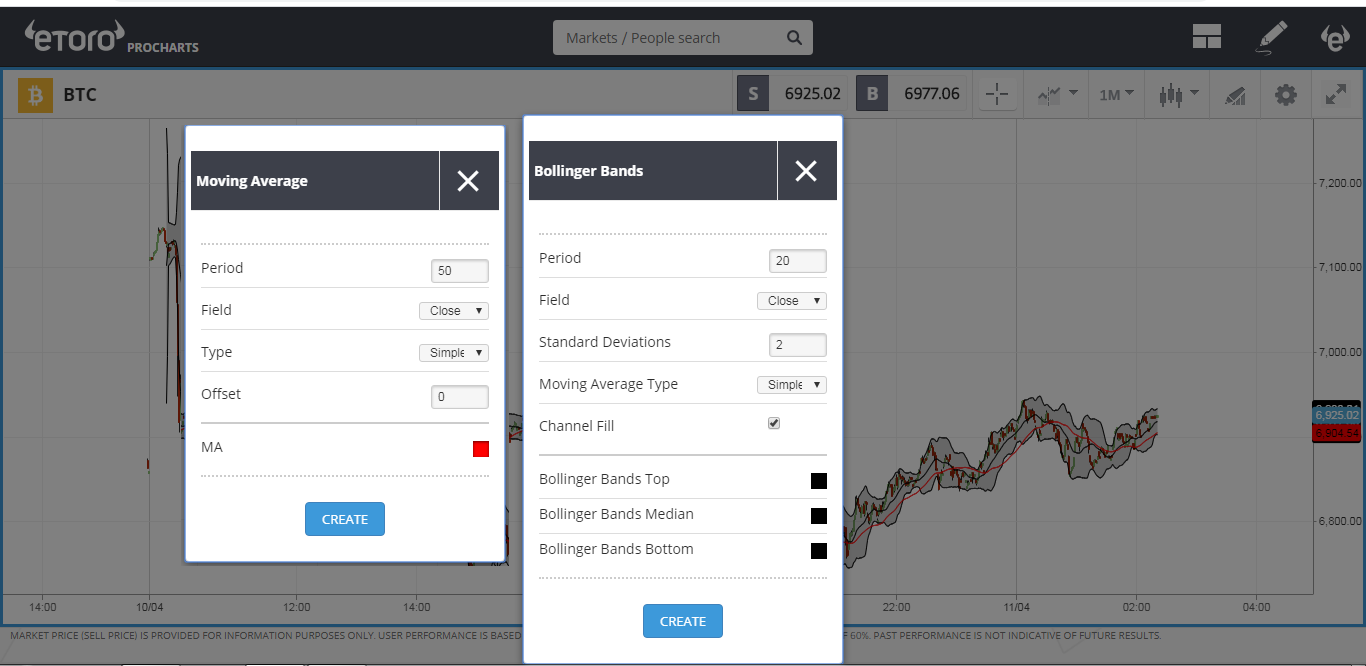
Can you please,see to it guys and let me know what changes I should make to the settings of the Study tools which can help me to bring the same figures results for both the time frames ?...
But, what I want is to see is that I get the same Figures of the 2 Mentioned Studies (for the 1 & 5 minutes) in chosen time frames.
Example; For Instance, Choosing a Candlestick for time 21:00, then for a 1 min. chart, I should be able to see the same figures of Studies (B. Bands and SMAs) as for a 5min. chart with the same time unit (i.e. 21:00) (i.e. irrespective of the Size of the Candlesticks)..
To explain more , I am attaching the Screen shots I did for the 1 min. & 5 min. Charts at different times..
Along with the study tools details I used for it.
Can you please,see to it guys and let me know what changes I should make to the settings of the Study tools which can help me to bring the same figures results for both the time frames ?...


*상업적 사용 및 스팸은 허용되지 않으며 계정이 해지될 수 있습니다.
팁: 이미지/유튜브 URL을 게시하면 게시물에 자동으로 삽입됩니다!
팁: @기호를 입력하여 이 토론에 참여하는 사용자 이름을 자동으로 완성합니다.


