


Advertisement
BBs and SMAs for M1 and M5 Charts
Apr 11, 2020 at 16:58
555浏览
1 Replies
Apr 11, 2020 at 16:58
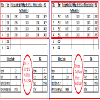
I am using Bollinger Bands and SMA Studies for the etoro Charts in 1 Min. & 5 Min. Time Frames..
But, what I want is to see is that I get the same Figures of the 2 Mentioned Studies (for the 1 & 5 minutes) in chosen time frames.
Example; For Instance, Choosing a Candlestick for time 21:00, then for a 1 min. chart, I should be able to see the same figures of Studies (B. Bands and SMAs) as for a 5min. chart with the same time unit (i.e. 21:00) (i.e. irrespective of the Size of the Candlesticks)..
To explain more , I am attaching the Screen shots I did for the 1 min. & 5 min. Charts at different times..
Along with the study tools details I used for it.
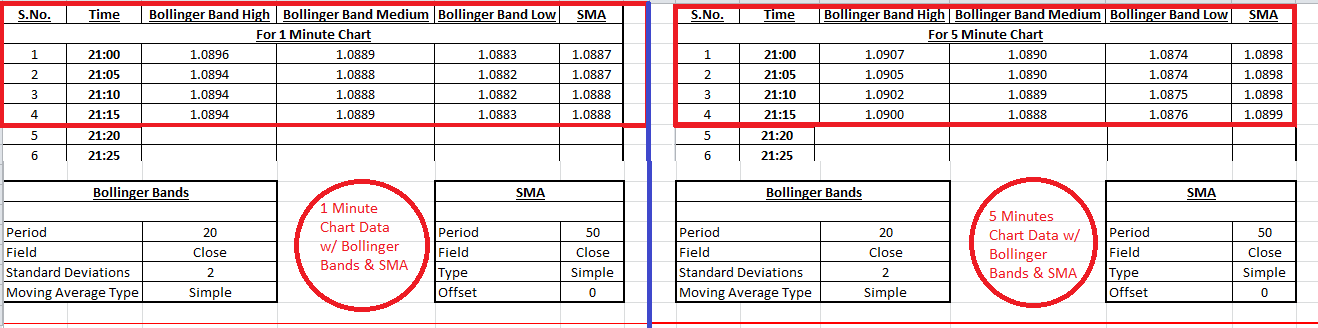
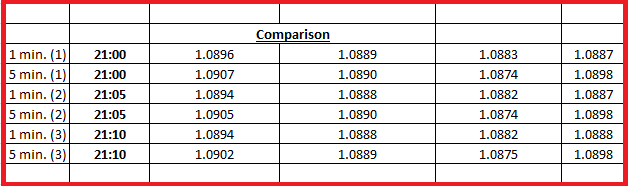
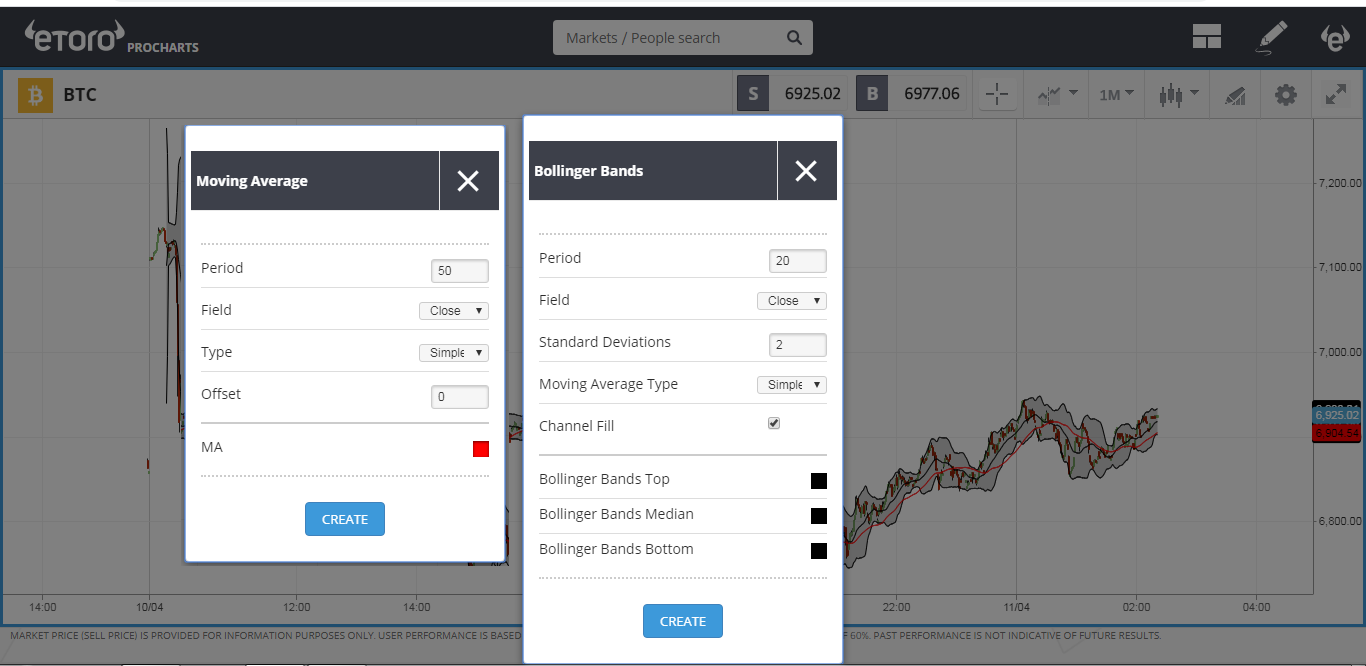
Can you please,see to it guys and let me know what changes I should make to the settings of the Study tools which can help me to bring the same figures results for both the time frames ?...
But, what I want is to see is that I get the same Figures of the 2 Mentioned Studies (for the 1 & 5 minutes) in chosen time frames.
Example; For Instance, Choosing a Candlestick for time 21:00, then for a 1 min. chart, I should be able to see the same figures of Studies (B. Bands and SMAs) as for a 5min. chart with the same time unit (i.e. 21:00) (i.e. irrespective of the Size of the Candlesticks)..
To explain more , I am attaching the Screen shots I did for the 1 min. & 5 min. Charts at different times..
Along with the study tools details I used for it.
Can you please,see to it guys and let me know what changes I should make to the settings of the Study tools which can help me to bring the same figures results for both the time frames ?...


*商业用途和垃圾邮件将不被容忍,并可能导致账户终止。
提示:发布图片/YouTube网址会自动嵌入到您的帖子中!
提示:键入@符号,自动完成参与此讨论的用户名。


