


gold advise

会员从Oct 11, 2013开始
775帖子
Jan 04, 2019 at 00:48
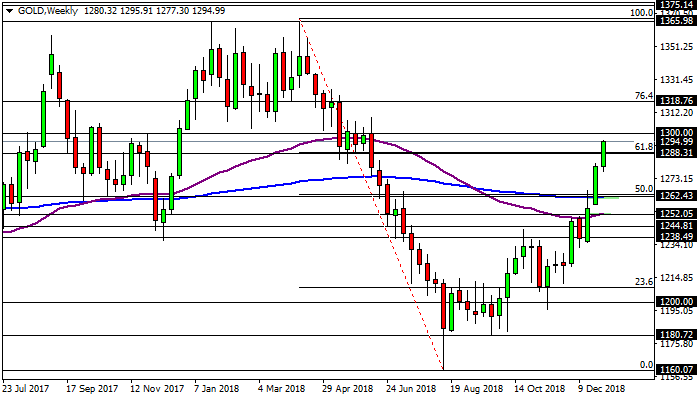
The bullish correction on gold continues and its price manages to break above the 61.8% Fibonacci retracement that we can see on the weekly chart, around the 1288 level. The price of gold has been retracing from the 1160 low but now the 1300 level could act as resistance. In case of continuing higher, the 76.4% Fibo at the 1318 level could act as resistance. The long term resistance is located at the 1365 peaks. On the other hand, if the price comes back down, then the 200 week EMA along with the 50% Fibo at the 1262 level could act as support.
附件:
会员从Oct 11, 2013开始
775帖子
Jan 14, 2019 at 22:42
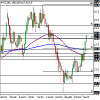
Gold has formed what it appears to be a bullish flag around the 61.8% Fibo on the daily chart at the 1288 level. The 1300 level may act as resistance, while the 1262 zone may act as support.


*商业用途和垃圾邮件将不被容忍,并可能导致账户终止。
提示:发布图片/YouTube网址会自动嵌入到您的帖子中!
提示:键入@符号,自动完成参与此讨论的用户名。


