


Typical Price Congestion on the daily Chart
Mar 14 at 15:39
108浏览
2 Replies

会员从Sep 01, 2022开始
24帖子
Mar 14 at 15:39
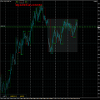
This is a typical congestion, where prices bounce back at the high of the measuring bar.
NZD/CHF - daily chart, congestion with 12 bars.
On the chart the daily congestion is displayed on the 4 hr chart.
There are blocks around each daily chart bar.
NZD/CHF - daily chart, congestion with 12 bars.
On the chart the daily congestion is displayed on the 4 hr chart.
There are blocks around each daily chart bar.
附件:
A little bit of knowledge is a dangerous thing!
会员从Sep 01, 2022开始
24帖子
Mar 15 at 12:16
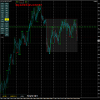
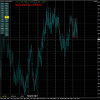
NZD/CHF - daily congestion with 13 bars today.
as so many times, prices trade back into the congestion between bar 11 and bar 17.
Again displayed on the 4 hr chart, showing the congestion high/low of the daily (red lines) surrounded by blocks to show what 4 hr bars belong to the daily bar.
as so many times, prices trade back into the congestion between bar 11 and bar 17.
Again displayed on the 4 hr chart, showing the congestion high/low of the daily (red lines) surrounded by blocks to show what 4 hr bars belong to the daily bar.
附件:
A little bit of knowledge is a dangerous thing!

*商业用途和垃圾邮件将不被容忍,并可能导致账户终止。
提示:发布图片/YouTube网址会自动嵌入到您的帖子中!
提示:键入@符号,自动完成参与此讨论的用户名。


