


GBP/USD’s bullish streak hits a wall

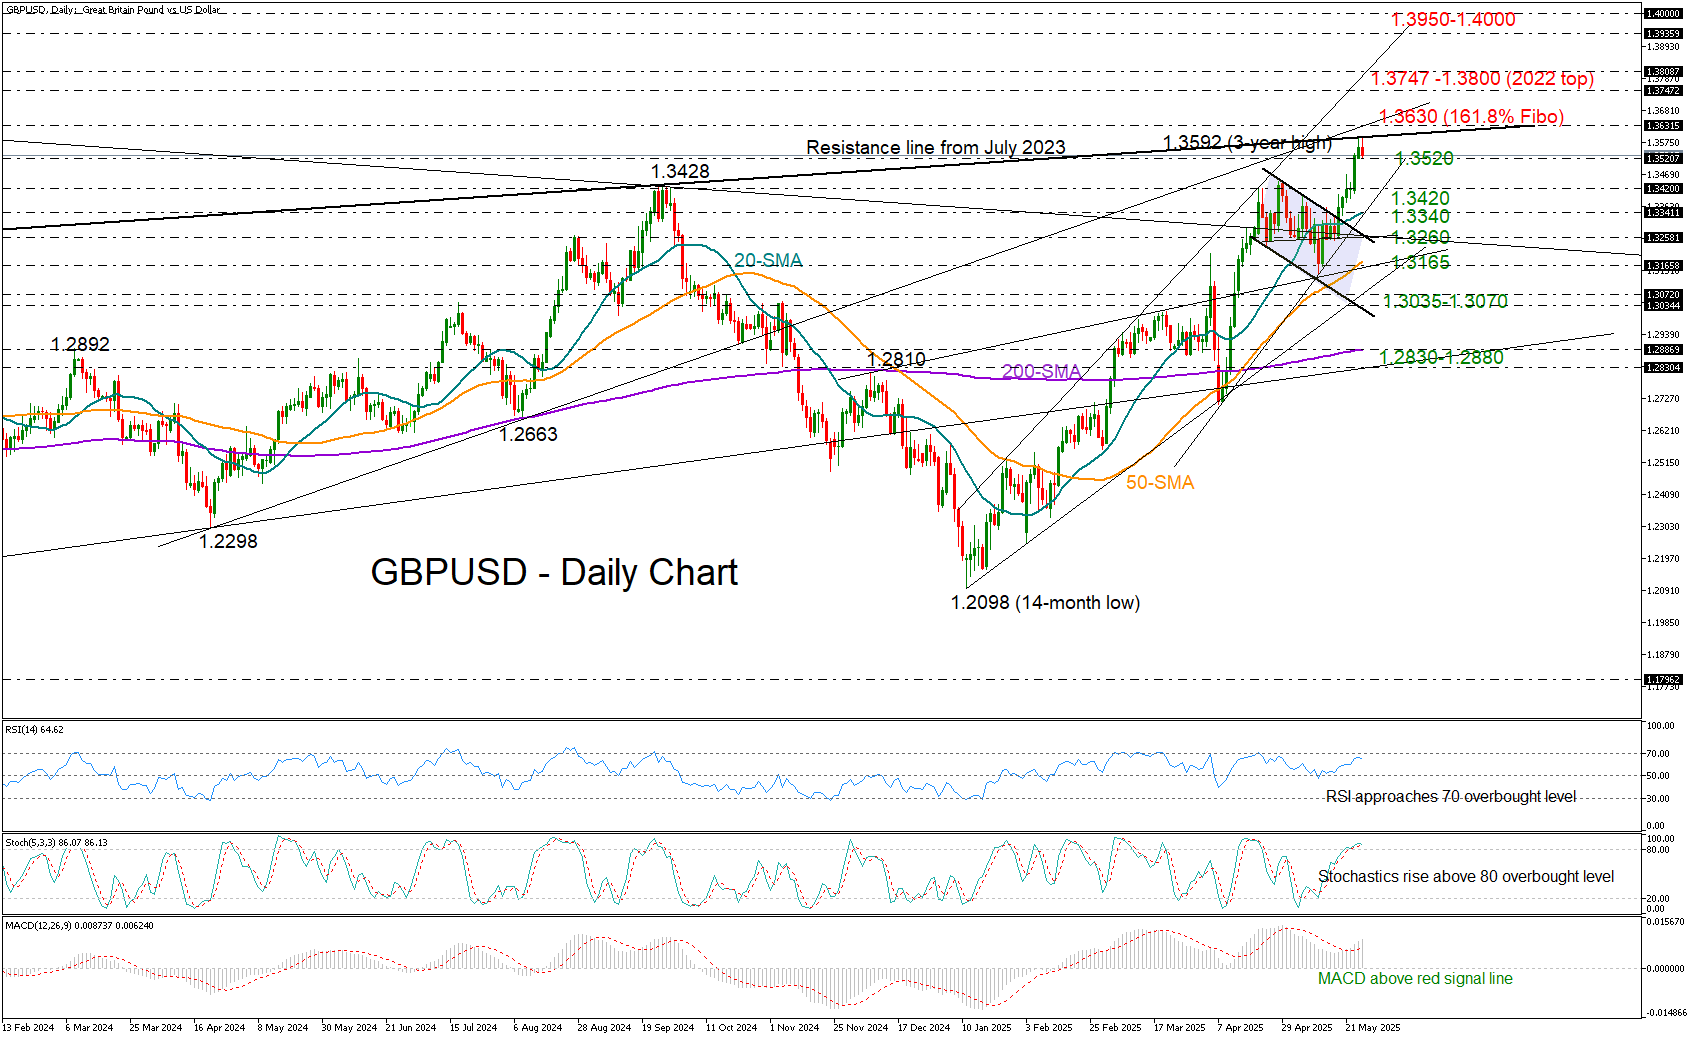
GBP/USD was trading with softer positive momentum during Tuesday’s early European session, following a surge to a new three-year high of 1.3592 on Monday.
Stronger-than-expected CPI inflation and business PMI figures, combined with a weakening US dollar, triggered a fresh rally last week. However, with the pair now testing a tentative resistance line that connects the highs from July 2023 and September 2024 at 1.3590– after six consecutive winning sessions - a slowdown may be on the horizon. Notably, both the RSI and the stochastic oscillator are approaching overbought territory, increasing the likelihood of a near-term pullback.
If upside momentum fades and the pair retreats below the 1.3520 level, support could emerge near the 1.3420 area or closer to the 20-day simple moving average (SMA), currently positioned at 1.3340. A break below that level could trigger fresh selling pressure, potentially driving the pair down toward 1.3260.
On the upside, a decisive move above the threshold of 1.3590 – and further beyond the 1.3630 zone, where the 161.8% Fibonacci extension of the previous downtrend intersects with the rising trendline from April 2024 and the 2022 resistance region– could open the door to the 2022 peak of 1.3747 and the psychological 1.3800 level, which aligns with the 2025 resistance line. A continued advance could even target the 1.3950–1.4000 zone.
In summary, GBP/USD is currently testing a significant resistance area. With technical indicators signaling overbought conditions, the bullish momentum may pause in the short term.
.jpg "GBP/USD’s bullish streak hits a wall")

Mixed Currency Moves as Traders Eye US Data, Global Economic Signals | 15th August 2025

ATFX Market Outlook 15th August 2025

Pound Hits Multi-Week High as Markets Await GDP Data

ATFX Market Outlook 14th August 2025

ATFX Market Outlook 12th August 2025

Gold Shines on Trade Fears, Yen Weakens as Tariff Threats Loom | 7th August 2025

Pound Under Pressure Ahead of Bank of England Meeting


