


EUR/USD
Jul 23, 2018 at 20:21
Fed-related negative mood from late last week keeps holding most majors. EUR/USD is hovering around 1.1700 and currently has settled at 1.1687. The pair continues trading within tight range with no crear clues. On the four hour time frame the price is developing above its flat moving averages. RSI has lost directional strength and is located around its mid-line. Stochastic has turned sharply to downside and is showing strong bearish momentum. Bulls continue the fight for the 1.1700 level although the selling pressure remains strong between 1.1750 and 1.1720. The downside remains supported by 1.1685 and lower at 1.1650. Most likely the big movement will come on Thursday, when the ECB has its monetary policy meeting.

Jul 24, 2018 at 07:15
The EURUSD failed to continued its bullish momentum yesterday bottomed at 1.1683. We have a false breakout (above the trend line resistance )situation as you can see on my H1 chart below suggests a bearish view. The bias is bearish in nearest term testing 1.1650. Immediate resistance is seen around 1.1725. A clear break above that area could lead price to neutral zone in nearest term testing 1.1750 – 1.1790 region. On the downside, a clear break and daily close below 1.1650 would retest 1.1575 but key support remains around 1.1500 which need to be clearly broken to the downside to resume the major bearish trend.
Top Forex Robot
Jul 24, 2018 at 10:10
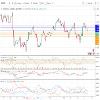
Yesterday, we saw some profit booking in EUR/USD and today, selling has started. We think that for the rest of the day, bears will be calling the shots. On 4-H chart, the pair is trading with slight bullish momentum which we expect to not last very long. For the day, the pair has four targets at 1.16719, 1.16633, 1.16537 and 1.16381 level.
Moreover, MACD indicator is in support of the bearish move with MACD line below the signal line, which depicts selling pressure.
On the upfront, the pair might face first resistance at 1.16833 level. A break above this level, next resistance will come at 1.17076 level and then at 1.17189 level.
Moreover, MACD indicator is in support of the bearish move with MACD line below the signal line, which depicts selling pressure.
On the upfront, the pair might face first resistance at 1.16833 level. A break above this level, next resistance will come at 1.17076 level and then at 1.17189 level.
Anhänge:
Mitglied seit Feb 02, 2017
37 Posts
Jul 26, 2018 at 08:17
EURUSD facing forming a double top at 1.17460-1.17520 area in 4 hours chart. If the pair sustain above 1.17520 levels we can see the upside move till 1.17820. we expect the pair will be weak later in the day at 1.17050 and 1.16880.
Anhänge:
Jul 26, 2018 at 16:13
The EUR/USD pair turned sharply to the downside, retracing from closer to weekly highs and weakened further below the 1.1700 mark after the latest ECB monetary policy update with Draghi reaffirming to hold interest rates steady through the summer of 2019. Currently the pair is trading at 1.1656, but the huge selling pressure might drag the pair towards the 1.1600 handle, which if broked to below will open doors for testing next support lines at 1.1575 and 1.1535. Looking to the upside, 1.1700 remains a resistance hard to achieve, but in case of any bullish attempts next target is provided by 1.1725 and 1.1745.
Mitglied seit Aug 10, 2017
12 Posts
Jul 27, 2018 at 06:54
Do you know what the fundamentals are like for EURUSD? I have a look at the some economic data and some looked good some looked bad. I would like to trade with the fundamental picture but it is difficult to know what that is

Mitglied seit Mar 28, 2016
93 Posts
Jul 30, 2018 at 10:09
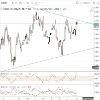
The EURUSD had a bearish momentum last week bottomed at 1.1620. However, price is still trapped inside the triangle formation as you can see on my H4 chart below and we need a clear break from the triangle to see clearer direction. The bias is neutral in nearest term. Immediate resistance is seen around 1.1675. A clear break above that area could trigger further bullish pressure retesting the upper line of the triangle located around 1.1730/50 area which is a good place to sell with a tight stop loss. Immediate support is seen around the lower line of the triangle and 1.1600 – 1.1575 support area. A clear break below that area would retest 1.1500 key support which need to be clearly broken to the downside to resume the major bearish trend.

Aug 03, 2018 at 11:42
snapdragon1970 posted:What to do you think is it the correct time for a quick trade?
Hi everyone,quick scalp ,eur/usd resistance line was 10860,as you can see we got a tiny push above to knock out stop losses,simple trade,just wait for it to pop above,10 points in the bag.Lets see if it does the same at 10836 resistance line.


Mitglied seit Aug 01, 2018
11 Posts
Aug 16, 2018 at 10:03
EURUSD fell below those levels months ago. It is down to 1.14 today


