


The Price Bar Alphabet (PBA) and more!
Mar 11 at 11:48
167 Angesehen
8 Replies

Mitglied seit Sep 01, 2022
22 Posts
Mar 11 at 11:48
Beginners should first learn the PBA. It gives them confidence when they view a chart.
When reading a book one needs to know the alphabet as well.
Learn about what is called a:
DOJI BAR, INSIDE BAR, REVERSAL BAR, INSIDE REVERSAL BAR, INSIDE DOJI BAR, VIOLATION BAR, HALF CORRECTION BAR, FULL CORRECTION BAR, OUTSIDE BAR and CROW BAR.
Once a trader can identify these bars and understands their impact on the trend or consolidation, he/she is already halfway there.
The next step is to learn how PRICE CONSOLIDATIONS work.
There are CONSOLIDATIONS, CONGESTIONS and TRADING RANGES.
A stock trader should also learn about GAPs, there are:
BREAK-AWAY GAPS, RUN-AWAY GAPS and EXHAUSTION GAPS.
Once that is accomplished, there are more or less only personal issues that need to be controlled and resolved (fear of success) to set up your trading business and operate it successfully.
All can be downloaded from my website as PDF, in English or German - it's free!
A little bit of knowledge is a dangerous thing!
Mitglied seit Feb 22, 2024
26 Posts
Mar 12 at 00:47
The analogy of learning the trading alphabet is intriguing. Exploring bars like DOJI, INSIDE, and REVERSAL lays a solid foundation for chart analysis. Moving on to PRICE CONSOLIDATIONS—CONSOLIDATIONS, CONGESTIONS, and TRADING RANGES—the nuances in patterns shape effective trading strategies. Gaps, including BREAK-AWAY, RUN-AWAY, and EXHAUSTION GAPS, offer insights into market behaviors. The thread concludes by highlighting personal challenges in trading, emphasizing the obstacle of overcoming the fear of success. A downloadable comprehensive guide in English or German is also available. Thoughts on these insights?
Mitglied seit Sep 01, 2022
22 Posts
Mar 12 at 18:30
The DOJI Bar
often is an indication of the end of a trend or the beginning of a trend, when it occurs in consolidation or congestion.
A 'measuring bar' is needed to determine if a sideways move is to be expected.
A 'measuring bar' is a bar that is followed by at least 4 bars, of which the open price or the close price or both (open and close) are inside the high and the low of the 'measuring bar'.
When counting the bars (including the measuring bar) there have to be a total of at least 5 bars finished to call it consolidation.
It often is the case, that the 3rd or 4th bar after the measuring bar is a DOJI bar, or the open and close are very close together.
The next current bar that opens (6. bar) is the most dangerous bar to trade in consolidation and is best left alone and wait for bar 7.
It is not all that big a deal if it is the 15 min chart or faster, but it can be a big problem, if it is the monthly or weekly timeframe.
When there are 10 or more bars after the measuring bar, prices are in congestion.
First bar where a trade can be attempted is bar 17.
If there are more than 21 bars after a measuring bar, it is called a trading range.
Always check for DOJI bars near bar 3 or 4 to stop trading
near bar 9 or 10 to continue trading, and near bar 17 or higher to trade out of congestion.
Software that shows all this can be downloaded for free.
A little bit of knowledge is a dangerous thing!
Mitglied seit Sep 01, 2022
22 Posts
Mar 12 at 18:38
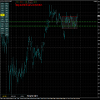
Check out the monthly chart of EUR/AUD
It is in congestion with the current bar being Nr. 12.
It is easy to find the measuring bar. Just count 12 bars back, including the March bar, and you will see, that all following bars after the measuring bar have either open or close inside the high and the low of the measuring bar.
In this case, all bars following the MB have open AND close inside.
With that knowledge, all you need to do is trade inside the high and the low of the measuring bar which is approx. 750 pips long, until bar 17 starts.
If prices break out of the high or low of the MB before bar 17, you should not expect more than 12.5% of the total length of the MB.
A little bit of knowledge is a dangerous thing!
Mitglied seit Sep 01, 2022
22 Posts
Mar 12 at 18:44
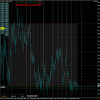
Check out USD/CHF
the daily chart is in congestion with a total of 21 bars, including today's bar.
In this case, the 5th bar after the MB is a DOJI bar.
And bar 19 (Friday) was a DOJI as well.
Just apply the rules as outlined above, then an attempt to trade is much safer than going by indicator readings.
the daily chart is in congestion with a total of 21 bars, including today's bar.
In this case, the 5th bar after the MB is a DOJI bar.
And bar 19 (Friday) was a DOJI as well.
Just apply the rules as outlined above, then an attempt to trade is much safer than going by indicator readings.
A little bit of knowledge is a dangerous thing!
Mitglied seit Sep 01, 2022
22 Posts
Mar 12 at 18:47
Check out AUD/NZD
the 4 hr chart is in congestion with currently 14 bars.
This congestion looks different, because quite a few bars have only the Open OR the Close inside the high and low of the MB.
But that is the rule. One or the other or both.
the 4 hr chart is in congestion with currently 14 bars.
This congestion looks different, because quite a few bars have only the Open OR the Close inside the high and low of the MB.
But that is the rule. One or the other or both.
A little bit of knowledge is a dangerous thing!
Mitglied seit Sep 01, 2022
22 Posts
Mar 12 at 18:54
Check out EUR/GBP
the daily chart is in a trading range with 34 bars.
The MB is easy to find by counting 34 bars back, including today's bar.
This range is very flat (approx. 40 pips) and it's better to wait for a break out and trade the first hook outside of the range
Since the monthly chart is in congestion with 16 bars, and prices right now are at the low of the monthly MB (0.8547)
I would look at trading back into the monthly congestion. the high is 0.8877
A little bit of knowledge is a dangerous thing!
Mitglied seit Sep 01, 2022
22 Posts
Mar 14 at 14:02
The CAD/CHF is in congestion on the daily chart.
Best is, to find a SELL entry on a faster timeframe since chances are, that prices will trade back into the congestion.
On this chart you see the daily congestion, displayed on the 4 hr. chart timeframe.
Best is, to find a SELL entry on a faster timeframe since chances are, that prices will trade back into the congestion.
On this chart you see the daily congestion, displayed on the 4 hr. chart timeframe.
Anhänge:
A little bit of knowledge is a dangerous thing!

*Kommerzielle Nutzung und Spam werden nicht toleriert und können zur Kündigung des Kontos führen.
Tipp: Wenn Sie ein Bild/eine Youtube-Url posten, wird diese automatisch in Ihren Beitrag eingebettet!
Tipp: Tippen Sie das @-Zeichen ein, um einen an dieser Diskussion teilnehmenden Benutzernamen automatisch zu vervollständigen.


