


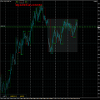
Typical Price Congestion on the daily Chart
Mar 14 at 15:39
91 Angesehen
2 Replies

Mitglied seit Sep 01, 2022
22 Posts
Mar 14 at 15:39
This is a typical congestion, where prices bounce back at the high of the measuring bar.
NZD/CHF - daily chart, congestion with 12 bars.
On the chart the daily congestion is displayed on the 4 hr chart.
There are blocks around each daily chart bar.
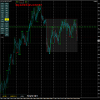
NZD/CHF - daily chart, congestion with 12 bars.
On the chart the daily congestion is displayed on the 4 hr chart.
There are blocks around each daily chart bar.
Anhänge:
A little bit of knowledge is a dangerous thing!
Mitglied seit Sep 01, 2022
22 Posts
Mar 15 at 12:16
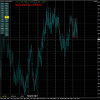
NZD/CHF - daily congestion with 13 bars today.
as so many times, prices trade back into the congestion between bar 11 and bar 17.
Again displayed on the 4 hr chart, showing the congestion high/low of the daily (red lines) surrounded by blocks to show what 4 hr bars belong to the daily bar.
as so many times, prices trade back into the congestion between bar 11 and bar 17.
Again displayed on the 4 hr chart, showing the congestion high/low of the daily (red lines) surrounded by blocks to show what 4 hr bars belong to the daily bar.
Anhänge:
A little bit of knowledge is a dangerous thing!

*Kommerzielle Nutzung und Spam werden nicht toleriert und können zur Kündigung des Kontos führen.
Tipp: Wenn Sie ein Bild/eine Youtube-Url posten, wird diese automatisch in Ihren Beitrag eingebettet!
Tipp: Tippen Sie das @-Zeichen ein, um einen an dieser Diskussion teilnehmenden Benutzernamen automatisch zu vervollständigen.


