


Advertisement
Bitcoin (BTC) analysis thread

Apr 08, 2020 at 14:57

Hi all. Like i`ve promised you last week, today i`ve made a very long term BTC analysis. In this analysis it`s all about next expected all time high (ATH) in a matter of price and time. It`s a bit more conservative or realistic even than the last long term one in which I`ve pointed $170k as a ATH price. I`m not saying that $170k is impossible but this analysis is more conservative like I already said. So let`s go.
All is a simple math and price action.
1. The 1st ATH after the 1st halving took 334 days from the halving and the price increased with around 11000% from the halving since the ATH.
2. The 2nd ATH after the 2nd halving took 518 days from the halving and the price increased with around 3100% from the halving since the ATH.
Counting on the mentioned above the 3rd ATH after the 3rd halving must take 800 days from the halving and the price must increase with around 900-1000%. Why? Simple math and multiplication. If the price at this year`s halving is around $7000, this is setting the price around $70000 per single BTC somewhere around June 2022 (confirmation to the same date from the previous long term analysis).
Another question can be why every time it took more days and the price increasing is lower. Simple again – Because with the price increase it needs more and more money to be pumped for the same or even smaller price move in time.
Why i`ve marked the start of the next ATH period from Dec `21? That`s more because of the sentiment or feeling than to some numbers. The single fact here is that every ATH since now was happened Nov-Dec next year after the halving year or simply said – 4 years after last ATH. That`s why Dec`21 or even Jan`22 is a good start of the next ATH period or even the exact ATH time.
There`s nothing more to be said here so let`s summarize all about the next expected Bitcoin ATH:
PRICE: around $70000
TIME: from Dec`21 to June`22
P.S. I`m really curious to see your thoughts about the next Bitcoin ATH too.
Fichiers joints:
momchil_slavov@

Membre depuis Apr 09, 2019
posts 516
Apr 08, 2020 at 17:40
I can see the logic based on the increases following the past 2 halvings. The numbers seem mad at first glance but you can see why you have come to them.
If you can't spot the liquidity then you are the liquidity.
Membre depuis Feb 16, 2019
posts 26
Apr 08, 2020 at 18:08
Looks good to me !
Membre depuis Apr 06, 2020
posts 3
Apr 09, 2020 at 08:54
momo3HC posted:
Hi all. Like i`ve promised you last week, today i`ve made a very long term BTC analysis. In this analysis it`s all about next expected all time high (ATH) in a matter of price and time. It`s a bit more conservative or realistic even than the last long term one in which I`ve pointed $170k as a ATH price. I`m not saying that $170k is impossible but this analysis is more conservative like I already said. So let`s go.
All is a simple math and price action.
1. The 1st ATH after the 1st halving took 334 days from the halving and the price increased with around 11000% from the halving since the ATH.
2. The 2nd ATH after the 2nd halving took 518 days from the halving and the price increased with around 3100% from the halving since the ATH.
Counting on the mentioned above the 3rd ATH after the 3rd halving must take 800 days from the halving and the price must increase with around 900-1000%. Why? Simple math and multiplication. If the price at this year`s halving is around $7000, this is setting the price around $70000 per single BTC somewhere around June 2022 (confirmation to the same date from the previous long term
analysis).
Another question can be why every time it took more days and the price increasing is lower. Simple again – Because with the price increase it needs more and more money to be pumped for the same or even smaller price move in time.
Why i`ve marked the start of the next ATH period from Dec `21? That`s more because of the sentiment or feeling than to some numbers. The single fact here is that every ATH since now was happened Nov-Dec next year after the halving year or simply said – 4 years after last ATH. That`s why Dec`21 or even Jan`22 is a good start of the next ATH period or even the exact ATH time.
There`s nothing more to be said here so let`s summarize all about the next expected Bitcoin ATH:
PRICE: around $70000
TIME: from Dec`21 to June`22
P.S. I`m really curious to see your thoughts about the next Bitcoin ATH too.[/quote
I like your forecasts and your market analysis method.]
May 10, 2020 at 16:24
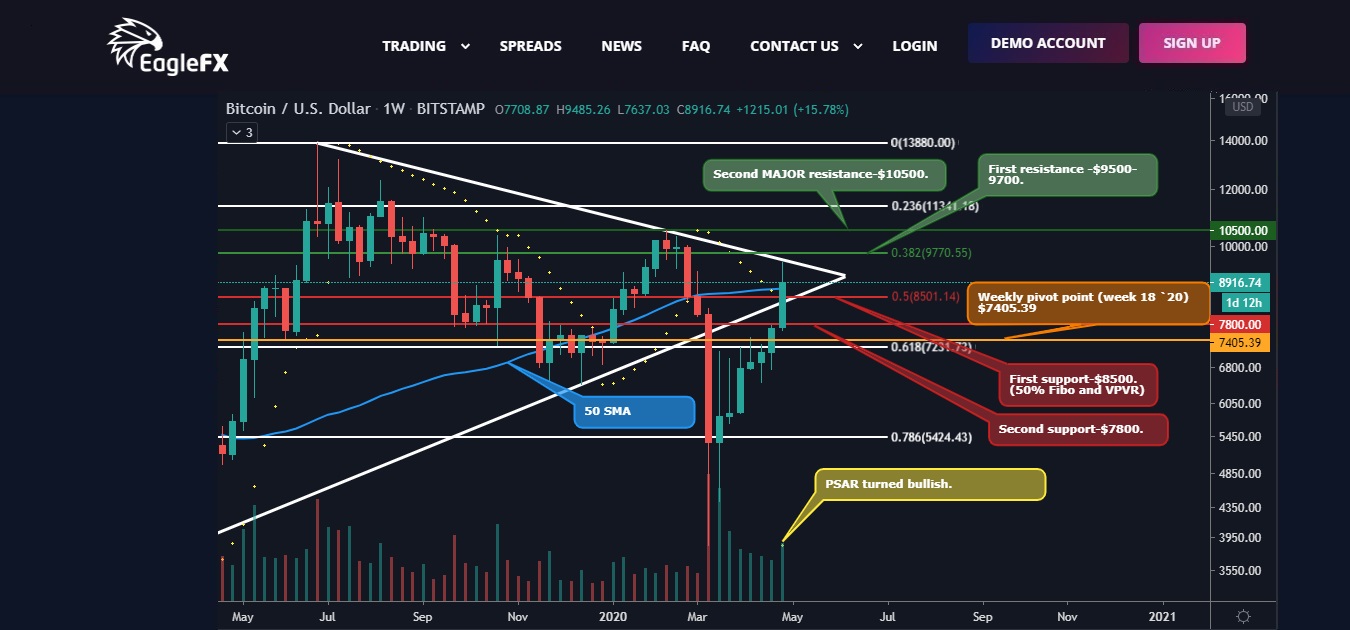
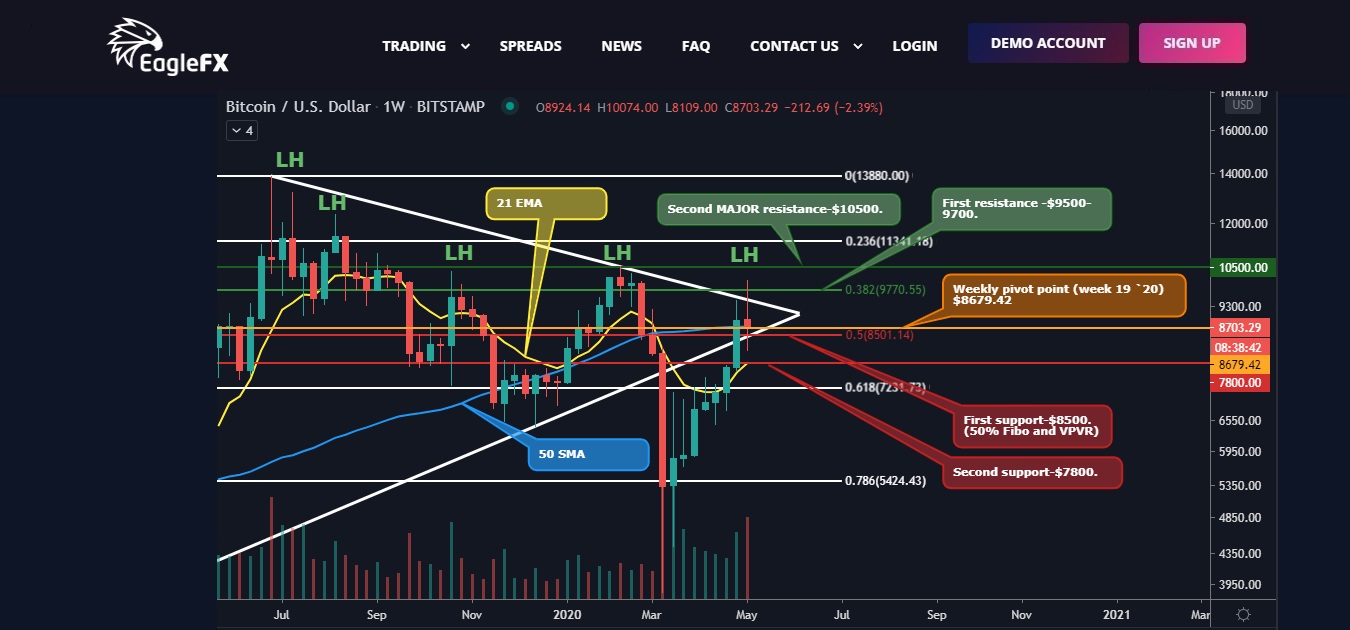
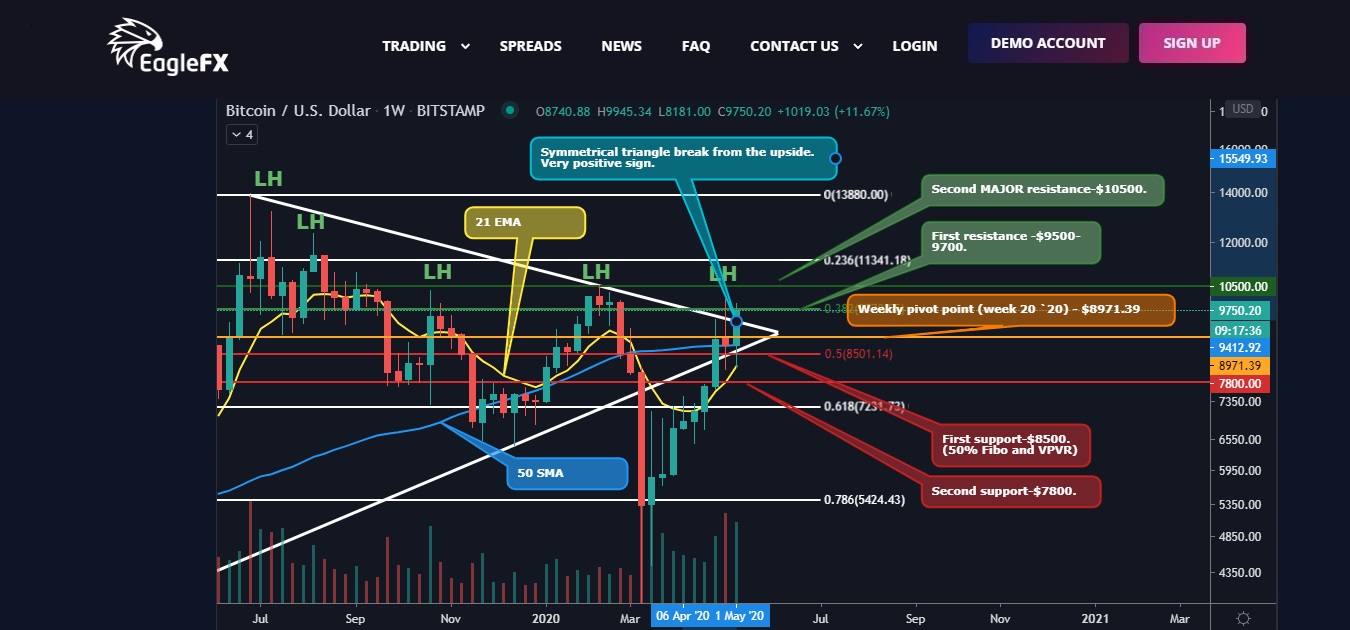
Hi all. Some time no see from me but here I am again. First of all what a week from BTC wow, but a perfect price action follow from it. Into the next couple of analysis i`ll show you the needed steps 1 by 1 from BTC to reach the next ATH. But let`s start from the mid-term situation (chart 1).
First we`re back into the triangle which we`ve broke down in the beginning of March. Let`s see where we`ll break it now.
Secondly we`re back above the 50 weekly SMA. Another bullish signal.
Third, PSAR also turned bullish.
Fourth, we`re way above the weekly pivot point ($7405.39) – bullish. This is for the 7th consecutive week and also we have 7 consecutive green weeks. That`s something we didn`t saw from February 2019, the start of the 14K run. Isn`t that bullish?
Fifth, we`re back above the 200 daily SMA. All that 5 facts makes me super bullish!
Actual support and resistance:
1. Support:
1st support - $8500 - 50% Fibo and VPVR profile
2nd support - $7800 2.
Resistance:
1st resistance - $9500-9800
2nd resistance - $10500 – that will be a MAJOR resistance not only for the mid-term but also in a long-term, on the way to the next ATH. This in short is the mid-term look – BULLISH.
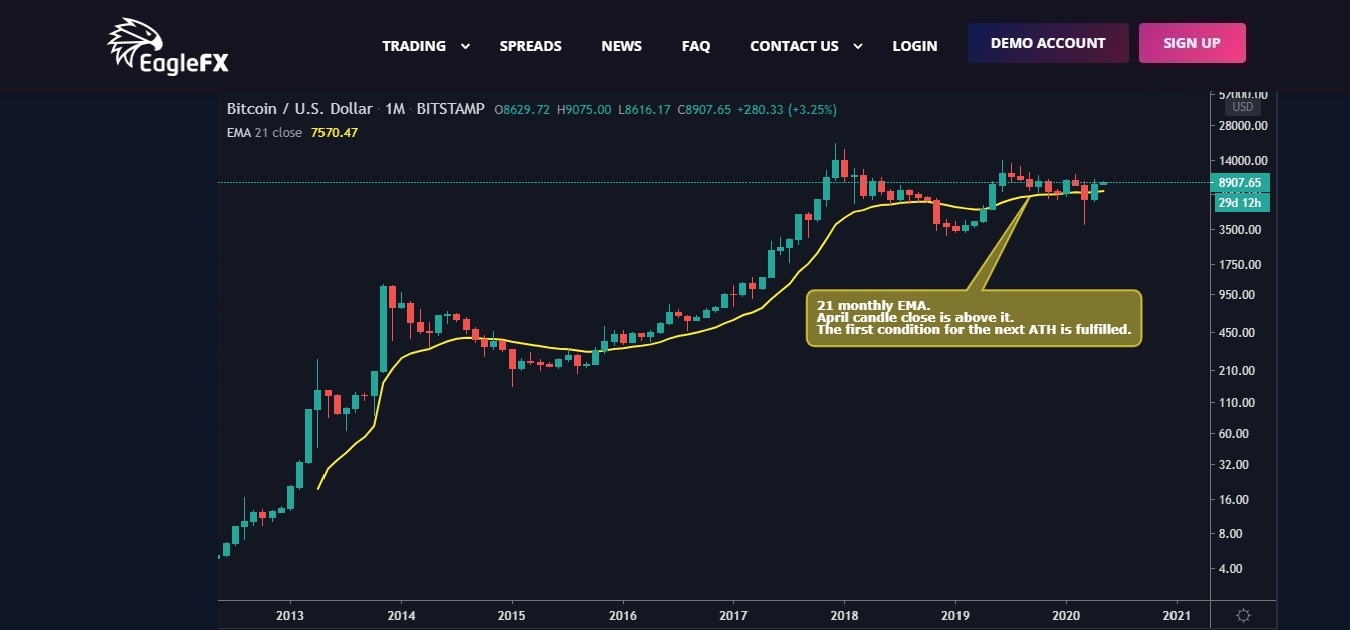
Now let`s see the first step from the long-term ATH scenario. (chart 2)
A very simple monthly chart. The only indicator here is the 21 monthly EMA. Like you`ll see every time when we`re above it we`re going up. Yes, in March we went below but in April we`re not only get back above it but the April`s candle fully recovered the March one and even a bit more. Like I said that`s the first needed step for the long-term bull run and even the next ATH. What`s the others? You`ll see into the next analysis.
Fichiers joints:

momchil_slavov@
May 10, 2020 at 16:25
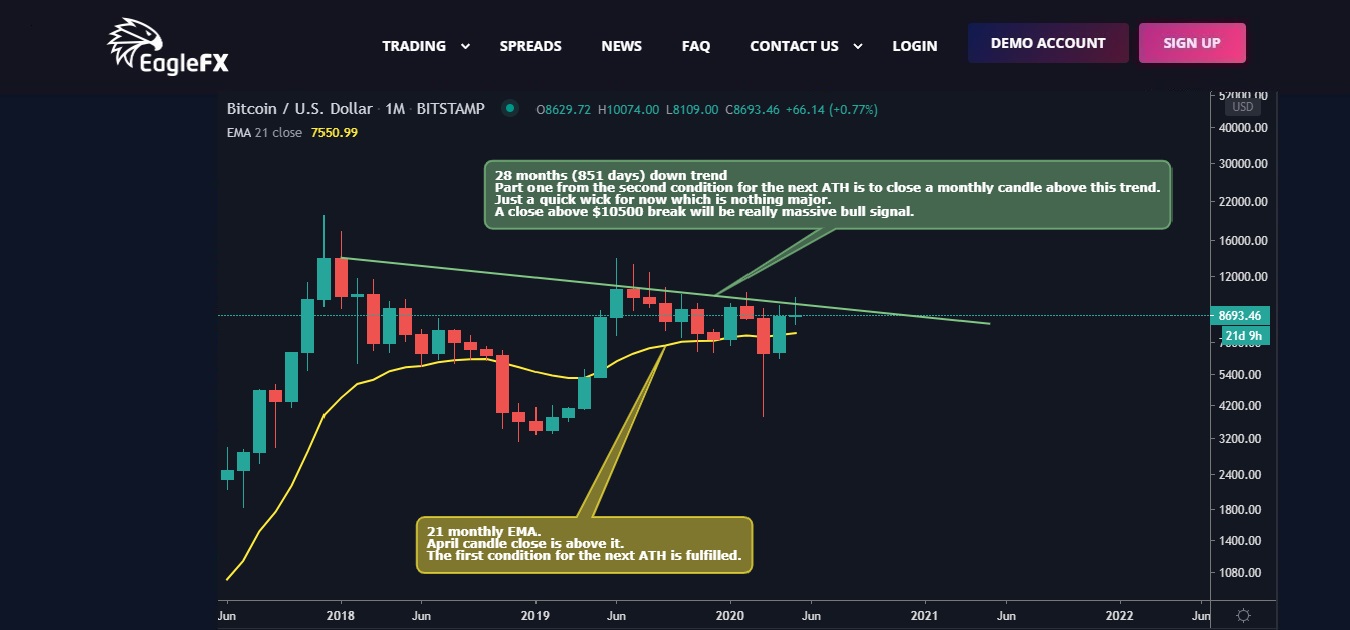
Hi all. Like i`ve promised you last time, into the next couple of analysis i`ll show you the needed steps 1 by 1 from BTC to reach the next ATH. I`ve discussed the first one last time and now it`s a time for the second. Part one from the second condition for the next ATH (chart 1).
It`s simple. Part one from the second condition for the next ATH is to close a monthly candle above this actual down trend. This trend is massive. 28 months (851 days). That`s why it`s so important to break it. Just a quick wick for now which is nothing major. A close above $10500 break will be really massive bull signal and then this first part will be done. The good point at this chart is that we`re still above the 21 monthly EMA (this was the first condition for the next ATH).
Part two from the second condition for the next ATH (chart 2). It is to mark a HH (higher high) into the weekly chart. This means a close of a weekly candle above… guess what price… $10500. Yes, we were close before the latest dip but nothing`s yet lost. In summary: the needed level is $10500 and we need a monthly candle close and a weekly candle close both above it.
Actual support and resistance:
1. Support:
1st support - $8500 - 50% Fibo and VPVR profile
2nd support - $7800
2. Resistance:
1st resistance - $9500-9800
2nd resistance - $10500 – that will be a MAJOR resistance not only for the mid-term but also in a long-term, on the way to the next ATH like mentioned above.
3. Weekly pivot point is $8679.42. The price is moving around it now and let`s see how it will end the week. 4. 50 SMA situation is same like the pivot point. The price is moving around it now and let`s see how it will end the week.
5. 21 weekly EMA is far below the price for now. Not bad.
In short $10500 is my golden price line. If we go above it… MOON and beyond!
See ya next time with the third part of ATH scenario.
Fichiers joints:
momchil_slavov@

Membre depuis Mar 18, 2019
posts 97
May 11, 2020 at 06:59
momo3HC posted:
Hi all. Like i`ve promised you last time, into the next couple of analysis i`ll show you the needed steps 1 by 1 from BTC to reach the next ATH. I`ve discussed the first one last time and now it`s a time for the second. Part one from the second condition for the next ATH (chart 1).
It`s simple. Part one from the second condition for the next ATH is to close a monthly candle above this actual down trend. This trend is massive. 28 months (851 days). That`s why it`s so important to break it. Just a quick wick for now which is nothing major. A close above $10500 break will be really massive bull signal and then this first part will be done. The good point at this chart is that we`re still above the 21 monthly EMA (this was the first condition for the next ATH).
Part two from the second condition for the next ATH (chart 2). It is to mark a HH (higher high) into the weekly chart. This means a close of a weekly candle above… guess what price… $10500. Yes, we were close before the latest dip but nothing`s yet lost. In summary: the needed level is $10500 and we need a monthly candle close and a weekly candle close both above it.
Actual support and resistance:
1. Support:
1st support - $8500 - 50% Fibo and VPVR profile
2nd support - $7800
2. Resistance:
1st resistance - $9500-9800
2nd resistance - $10500 – that will be a MAJOR resistance not only for the mid-term but also in a long-term, on the way to the next ATH like mentioned above.
3. Weekly pivot point is $8679.42. The price is moving around it now and let`s see how it will end the week. 4. 50 SMA situation is same like the pivot point. The price is moving around it now and let`s see how it will end the week.
5. 21 weekly EMA is far below the price for now. Not bad.
In short $10500 is my golden price line. If we go above it… MOON and beyond!
See ya next time with the third part of ATH scenario.
banging analysis bro! did you get some pips on BTC USD this weekend? btc to the moon 2020!!!
Membre depuis Apr 09, 2019
posts 516
May 11, 2020 at 11:29
Little dip over the weekend to get some cheaper buy prices I wonder. Hopefully still bullish!
If you can't spot the liquidity then you are the liquidity.
Membre depuis Feb 16, 2019
posts 26
May 13, 2020 at 18:53
no need to worry
May 17, 2020 at 15:03

Hi all. Like i`ve promised you last time, into the next couple of analysis i`ll show you the needed steps 1 by 1 from BTC to reach the next ATH. I`ve discussed the first two into my last two analysis and now it`s a time for the final third one.
Here`s the third step to the next ATH (chart 1).
Many of you will say that after every single halvening, the next ATH takes more time. That`s right but not at 100%. I`m finding a very strict and simple rule into the past 2 ATH. Yes the 20K ATH took more time from the halvening than the previous one but… and this is a big but, check the time between breaking the previous ATH price after the every halvening and the next ATH. In both cases it`s exactly 10 months.
And here comes the third step to the next ATH. We can say that 10 months after we break the $19666 price level we can expect the next all-time high. When will be that ATH? Like I said all depends from the nearly $20k break.
So let`s summarize all 3 steps.
1. 21 monthly EMA. April candle closed above it. The first condition is already fulfilled.
2. A monthly close above $10500 and a HH (higher high) into the weekly chart.
3. Break above the last ATH ($20k) and 10 months of time.
That`s all. Simple enough.
Actual situation (chart 2).
1. Support and resistance:
1.1. Support:
1st support - $8500 - 50% Fibo and VPVR profile
2nd support - $7800
1.2. Resistance:
1st resistance - $9500-9800
2nd resistance - $10500 – that will be a MAJOR resistance not only for the mid-term but also in a long-term, on the way to the next ATH like mentioned above.
2. Weekly pivot point is $8971.39. The price is far above it for now which is positive for the next week but let`s where this week will close.
3. 50 SMA situation is same like the pivot point. The price is far above it for now which is positive for the next week but let`s where this week will close.
4. 21 weekly EMA is far below the price for now. Not bad at all and it`s going to cross the 50 SMA which is another good sign.
5. With this week candle (if it close like now) we`re breaking the symmetrical triangle from the upside. Very positive sign.
That`s all for now.
See ya next time.
Fichiers joints:
momchil_slavov@
Membre depuis Apr 09, 2019
posts 516
May 18, 2020 at 07:12
Going to be an interesting 10 months for sure. I expect to see another push at $10k this week
If you can't spot the liquidity then you are the liquidity.
Membre depuis Feb 16, 2019
posts 26
May 18, 2020 at 15:06
A good outlook


