


Advertisement
LUX (由 MarcellusLux )
| 收益: | +33148.17% |
| 縮減 | 13.78% |
| 點: | 16679.7 |
| 交易 | 558 |
| 贏得: |
|
| 損失:。 |
|
| 類型: | 真實 |
| 杠杆率: | 1:500 |
| 交易: | 未知 |
LUX討論
Apr 17, 2023 at 08:10
Hi @MarcellusLux Dude can you tell more, what indicators do you use?

會員從May 19, 2020開始
321帖子
Apr 17, 2023 at 10:11
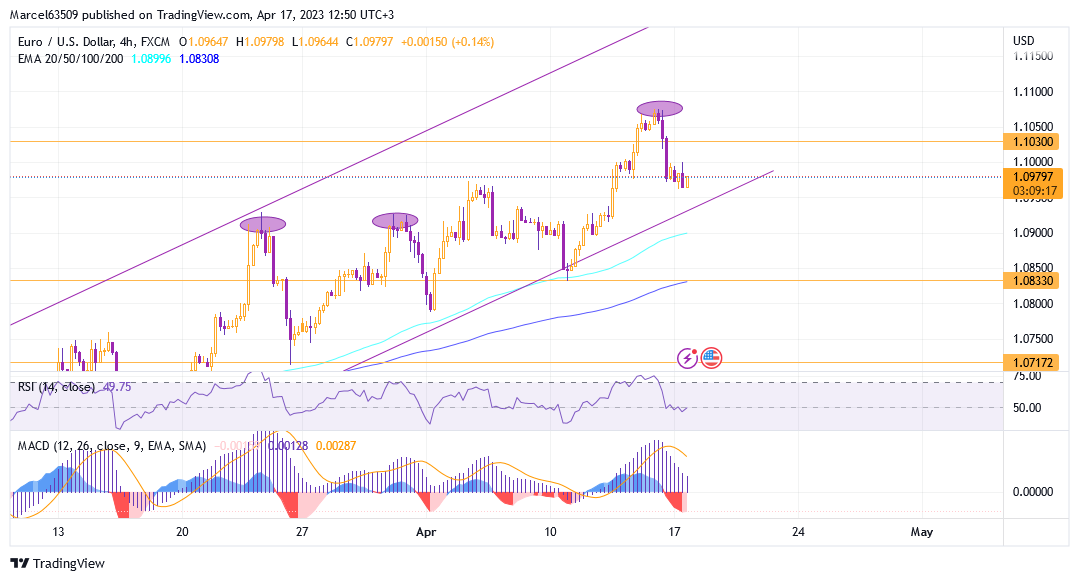
Euro Dollar reached the level of 1.10300 and even the next high at 1.10750, which will be a key resistance level for further growth and continuation of the uptrend. Now, the market is fluctuating inside the uptrend channel on the four-hour chart.
On the hourly chart, the price has already crossed the EMA 100 during a local correction, but is still above the EMA 200. This position provides me with the 2 marker levels at EMA lines on the hourly chart (1.10000 and 1.09500) for further movement. The MACD on the hourly chart shows a weak buy signal as well as a slight divergence that is better visible on the 30 minutes chart.
On the 4 hour MACD chart, there is a strong sell signal and the RSI is fluctuating around the 50 area, indicating that the market is temporarily uncertain. The divergence that was forming earlier was partially broken by the recent growth, but I will continue to take it into account, because it can be broken or continued with further market movement.
The chart shows an uptrend that is currently active and can be continued. But if the formation of the double top continues and the sell signals are confirmed, then this trend will be broken. Also a very important aspect is the presence of several support levels: 1.09200, 1.09000 (now EMA 100 on a four-hour chart) and 1.08330 (now EMA 200 on a four-hour chart).
Preliminarily, I estimate this situation as prone to short-term growth with a possible test of 1.10300 and even 1.10750. But after that, a fall will form, which may lead to a violation of the current trend. I have set marker and key levels that I will rely on while trading.
.png)
On the hourly chart, the price has already crossed the EMA 100 during a local correction, but is still above the EMA 200. This position provides me with the 2 marker levels at EMA lines on the hourly chart (1.10000 and 1.09500) for further movement. The MACD on the hourly chart shows a weak buy signal as well as a slight divergence that is better visible on the 30 minutes chart.
On the 4 hour MACD chart, there is a strong sell signal and the RSI is fluctuating around the 50 area, indicating that the market is temporarily uncertain. The divergence that was forming earlier was partially broken by the recent growth, but I will continue to take it into account, because it can be broken or continued with further market movement.
The chart shows an uptrend that is currently active and can be continued. But if the formation of the double top continues and the sell signals are confirmed, then this trend will be broken. Also a very important aspect is the presence of several support levels: 1.09200, 1.09000 (now EMA 100 on a four-hour chart) and 1.08330 (now EMA 200 on a four-hour chart).
Preliminarily, I estimate this situation as prone to short-term growth with a possible test of 1.10300 and even 1.10750. But after that, a fall will form, which may lead to a violation of the current trend. I have set marker and key levels that I will rely on while trading.
附件:
@Marcellus8610
會員從May 19, 2020開始
321帖子
Apr 18, 2023 at 13:44
DenverRRR posted:
Hi @MarcellusLux Dude can you tell more, what indicators do you use?
The basis of my strategy is trading within the trend and reversal using key and marker levels. My trading success started with trading on a long-term basis, including analyzing economic releases and events for long-term market impact. But in 2019, after developing LUX, I changed my trading style and for now, news information is supporting rather than decisive. The indicative technical tools set is EMA (100 and 200) + MACD + RSI as an additional tool. To determine the further market movements, I use an algorithm that allows me to calculate the probability of various scenarios that I base my trading and technical analysis on.
If you are interested, you can find this information on my page on the web site. The link is specified in the profile bio.
@Marcellus8610

會員從May 19, 2020開始
321帖子
Apr 19, 2023 at 00:24
Bitcoin looks quite confident now about its further growth. I would clarify that the small momentum from 27k to above 30k opened new medium-term prospects for Bitcoin. The level of 25000 was the initial signal, because the EMA 200 line on the weekly chart was crossed exactly at this price. Now, the 30000 level has been passed and the EMA 100 line has been crossed on the weekly chart. At the same time, I see a transition to positive MACD values, which may be the beginning of a more intensive growth to the level of 35k, which is a key historical level. As for the rise to the 48-50k level, I believe that this level should be considered with some caution, as it will provide strong resistance and possibly become a key level for a temporary or even deep correction back to values around 30k.
There is a slight divergence on the 4-hour chart, and a preliminary sell signal, so I assume that there will be a short-term correction before a possible upside impulse. This can also be noted from the RSI position, near 70 on the daily and weekly charts.
As for my opinion on the long-term future of bitcoin, I will clarify that I see it in a sufficiently promising position.
.png)
There is a slight divergence on the 4-hour chart, and a preliminary sell signal, so I assume that there will be a short-term correction before a possible upside impulse. This can also be noted from the RSI position, near 70 on the daily and weekly charts.
As for my opinion on the long-term future of bitcoin, I will clarify that I see it in a sufficiently promising position.
附件:
@Marcellus8610
Apr 19, 2023 at 11:31
MarcellusLux posted:DenverRRR posted:
Hi @MarcellusLux Dude can you tell more, what indicators do you use?
The basis of my strategy is trading within the trend and reversal using key and marker levels. My trading success started with trading on a long-term basis, including analyzing economic releases and events for long-term market impact. But in 2019, after developing LUX, I changed my trading style and for now, news information is supporting rather than decisive. The indicative technical tools set is EMA (100 and 200) + MACD + RSI as an additional tool. To determine the further market movements, I use an algorithm that allows me to calculate the probability of various scenarios that I base my trading and technical analysis on.
If you are interested, you can find this information on my page on the web site. The link is specified in the profile bio.
Ok, let me see it. And why do you choose this combination? I ask you because you're the trader with huge experience, and your opinion is important to me. I would like to know more info by person who succeeded in trading.
會員從Aug 19, 2022開始
51帖子
Apr 19, 2023 at 14:29
lexusxxx posted:
If I also join you MarcellusLux, will I be able to copy?
This is pamm account.
會員從May 19, 2020開始
321帖子
Apr 19, 2023 at 18:57
Goldbarrel posted:HusamHabib posted:
who tried it ?
I recently joined a Pamm account.
So far I have a small deposit of 10k, but I'm going to increase it if the profitability will be as good.
Thank you for your feedback on my trading.
@Marcellus8610
會員從May 19, 2020開始
321帖子
Apr 19, 2023 at 19:30
DenverRRR posted:
Hi @MarcellusLux I saw your trades these days. Dude it is impressive.
Thanks
@Marcellus8610
會員從May 19, 2020開始
321帖子
Apr 19, 2023 at 19:45
DenverRRR posted:
Ok, let me see it. And why do you choose this combination? I ask you because you're the trader with huge experience, and your opinion is important to me. I would like to know more info by person who succeeded in trading.
Thank you. This is indeed a historical process, because such a set of tools and including algorithms is an evolution from the beginning of my trading in 2009, (when I suffered losses by the way) to the successful LUX trading system now. It doesn't really matter what indicators you use as long as your trading will bring you profit. Indicators are just a visualization of market activity for easier perception of the necessary information.
@Marcellus8610
Apr 20, 2023 at 13:27
MarcellusLux posted:DenverRRR posted:
Hi @MarcellusLux Dude can you tell more, what indicators do you use?
The basis of my strategy is trading within the trend and reversal using key and marker levels. My trading success started with trading on a long-term basis, including analyzing economic releases and events for long-term market impact. But in 2019, after developing LUX, I changed my trading style and for now, news information is supporting rather than decisive. The indicative technical tools set is EMA (100 and 200) + MACD + RSI as an additional tool. To determine the further market movements, I use an algorithm that allows me to calculate the probability of various scenarios that I base my trading and technical analysis on.
If you are interested, you can find this information on my page on the web site. The link is specified in the profile bio.
I'm wondering.
What do you do when you get variations in the values that the indicators show?
會員從May 19, 2020開始
321帖子
Apr 20, 2023 at 17:12
lexusxxx posted:
If I also join you MarcellusLux, will I be able to copy?
no, investing or partnership does not include copy trading
@Marcellus8610
會員從May 19, 2020開始
321帖子
Apr 23, 2023 at 22:40
lexusxxx posted:MarcellusLux posted:lexusxxx posted:
If I also join you MarcellusLux, will I be able to copy?
no, investing or partnership does not include copy trading
Thanks. Does it mean I cannot connect my account to your one?
No, there is currently no such option.
Contact me in messages or [email protected]
@Marcellus8610
會員從May 19, 2020開始
321帖子
Apr 23, 2023 at 22:57
Cosmo11 posted:MarcellusLux posted:DenverRRR posted:
Hi @MarcellusLux Dude can you tell more, what indicators do you use?
The basis of my strategy is trading within the trend and reversal using key and marker levels. My trading success started with trading on a long-term basis, including analyzing economic releases and events for long-term market impact. But in 2019, after developing LUX, I changed my trading style and for now, news information is supporting rather than decisive. The indicative technical tools set is EMA (100 and 200) + MACD + RSI as an additional tool. To determine the further market movements, I use an algorithm that allows me to calculate the probability of various scenarios that I base my trading and technical analysis on.
If you are interested, you can find this information on my page on the web site. The link is specified in the profile bio.
I'm wondering.
What do you do when you get variations in the values that the indicators show?
I make a decision based on market conditions, possible risks, the importance of indicators, my current trading plan and the probable deviations from the expected movements.
In case I receive conflicting data from different sources, I will make the final decision, or pause the trading in order to find the reason (depending on which stage of the trade showed inaccuracy)
@Marcellus8610
Apr 24, 2023 at 09:34
MarcellusLux posted:Cosmo11 posted:MarcellusLux posted:DenverRRR posted:
Hi @MarcellusLux Dude can you tell more, what indicators do you use?
The basis of my strategy is trading within the trend and reversal using key and marker levels. My trading success started with trading on a long-term basis, including analyzing economic releases and events for long-term market impact. But in 2019, after developing LUX, I changed my trading style and for now, news information is supporting rather than decisive. The indicative technical tools set is EMA (100 and 200) + MACD + RSI as an additional tool. To determine the further market movements, I use an algorithm that allows me to calculate the probability of various scenarios that I base my trading and technical analysis on.
If you are interested, you can find this information on my page on the web site. The link is specified in the profile bio.
I'm wondering.
What do you do when you get variations in the values that the indicators show?
I make a decision based on market conditions, possible risks, the importance of indicators, my current trading plan and the probable deviations from the expected movements.
In case I receive conflicting data from different sources, I will make the final decision, or pause the trading in order to find the reason (depending on which stage of the trade showed inaccuracy)
Don't you think that if there are different data, then these are system errors?
會員從May 19, 2020開始
321帖子
Apr 24, 2023 at 15:03
DenverRRR posted:MarcellusLux posted:Cosmo11 posted:MarcellusLux posted:DenverRRR posted:
Hi @MarcellusLux Dude can you tell more, what indicators do you use?
The basis of my strategy is trading within the trend and reversal using key and marker levels. My trading success started with trading on a long-term basis, including analyzing economic releases and events for long-term market impact. But in 2019, after developing LUX, I changed my trading style and for now, news information is supporting rather than decisive. The indicative technical tools set is EMA (100 and 200) + MACD + RSI as an additional tool. To determine the further market movements, I use an algorithm that allows me to calculate the probability of various scenarios that I base my trading and technical analysis on.
If you are interested, you can find this information on my page on the web site. The link is specified in the profile bio.
I'm wondering.
What do you do when you get variations in the values that the indicators show?
I make a decision based on market conditions, possible risks, the importance of indicators, my current trading plan and the probable deviations from the expected movements.
In case I receive conflicting data from different sources, I will make the final decision, or pause the trading in order to find the reason (depending on which stage of the trade showed inaccuracy)
Don't you think that if there are different data, then these are system errors?
This is not always a true statement. But, of course, if I get incorrect data and signals from my trading system, then I start a deep analysis of possible mistakes.
@Marcellus8610
會員從May 19, 2020開始
321帖子
Apr 25, 2023 at 12:39
Today I would like to make a few posts with a short analysis of two trades that were the most interesting of the recent ones.
Overview data:
5 trades for the period from April 19 to April 24.
4 trades out of 5 are profitable and closed at the take profit.
1 losing trade was closed by stop loss.
Fully completed trading plan for the week and for the month: April profitability is 9.67%.
Overview data:
5 trades for the period from April 19 to April 24.
4 trades out of 5 are profitable and closed at the take profit.
1 losing trade was closed by stop loss.
Fully completed trading plan for the week and for the month: April profitability is 9.67%.
@Marcellus8610
.png)


