Advertisement
stevewalker - Manual Trading

Member Since Jan 14, 2010
2279 posts
Jun 26, 2012 at 08:59
Alligaturk posted:
Rule1 :
optimism patience discipline
Rule2: Money management.
rule3: never have fear greed
Steve, is that you? 😱

forex_trader_79941
Member Since Jun 06, 2012
1434 posts
Jun 26, 2012 at 09:53
not me.
Chikot posted:
Alligaturk posted:
Rule1 :
optimism patience discipline
Rule2: Money management.
rule3: never have fear greed
Steve, is that you? 😱
forex_trader_79941
Member Since Jun 06, 2012
1434 posts
Jun 26, 2012 at 09:54
(edited Jun 26, 2012 at 09:54)
a very short summery.
overall it is correct.
the issue is "devil is in details"😇
overall it is correct.
the issue is "devil is in details"😇
Alligaturk posted:
Rule1 :
optimism patience discipline
Rule2: Money management.
rule3: never have fear greed
forex_trader_79941
Member Since Jun 06, 2012
1434 posts
Jun 29, 2012 at 14:20
if trading with pepper razor account, trade with min 0.02 lot.
when trading with 0.01 lot it rounds up the comission from 7,53 to 8,00.
fyi.
walker
when trading with 0.01 lot it rounds up the comission from 7,53 to 8,00.
fyi.
walker
forex_trader_79941
Member Since Jun 06, 2012
1434 posts
Jun 29, 2012 at 17:24
(edited Jun 29, 2012 at 17:24)
when trades hold open very long, there is always a poss of reverse fast movement. today we had on many pairs corolated with EU.
read this.
if trader trade with time based charts trader should close trades at a certaion time which will be defined by the average position hold time from his trade history.
if trader trade with range based charts( renko charts - range bar charts ) trader should close trades at a certaion level which will be defined by the average position MFE MAE values from his trade history.
if trader trade with tick based charts trader should close trades at a certaion tick which will be defined by the average position tick values from his trade history.
walker
forex_trader_79941
Member Since Jun 06, 2012
1434 posts
Jun 30, 2012 at 00:43
(edited Jun 30, 2012 at 00:44)
Important
if you are trading with Robots
DO NEVER RUN ROBOT WITH VARIABLE SPREAD.
RUN YOUR ROBOT WITH FIX SPREAD ALL TIME, THAT BACK TESTED WITH MEAN SPREAD.
VARIABLE SPREAD IS A BIG TRAP TO FAIL ROBOTS.
ESPECIALLY SCALPERS!!
fyi
walker
if you are trading with Robots
DO NEVER RUN ROBOT WITH VARIABLE SPREAD.
RUN YOUR ROBOT WITH FIX SPREAD ALL TIME, THAT BACK TESTED WITH MEAN SPREAD.
VARIABLE SPREAD IS A BIG TRAP TO FAIL ROBOTS.
ESPECIALLY SCALPERS!!
fyi
walker
forex_trader_79941
Member Since Jun 06, 2012
1434 posts
Jun 30, 2012 at 10:43
(edited Jun 30, 2012 at 10:45)
I am working on a very simple system that can work with any time frame and any chart any ınstrument.
I use 3 different MA to determine the patterns. cross is not the key. key is the waves.
I use MA to determine waves. eyeballed on many currencies and seems to be working.
it is not possible to code it.
the idea is the faster MA waves over slover MA. very simple.
basicly this is the nature of the price action before moves.
hope I can make it work.
walker
Member Since Jan 14, 2010
2279 posts
Jun 30, 2012 at 10:44
(edited Jun 30, 2012 at 10:44)
Steve, I was reading one guy at Oanda. He back tested 2 ema's against 3 and told 2 ema's show better results.
forex_trader_79941
Member Since Jun 06, 2012
1434 posts
Jun 30, 2012 at 11:07
(edited Jun 30, 2012 at 11:07)
thanks for the input.
this is only faster wave over slower wave. thats all. if it runs ok I will post the scrrenshots here.
the good thing is determining stop is very easy.
last support/resistance + 2 pips. for all time frames. you can set +5 pip for daily chart.
I had checked commodities stocks currucies. it is always doing the same thing. is it %100 ofcourse not. the action does not mean that will move further. if it can win the war buyers/sellers it will or fail.
on the other hand,
today I was thinking, like on friday afternoon, HOW PRİCE STARTS TO MOVE ONE DİRECTİON WITH ALL MOMENTUM AND STRENGTH? FX market is very deep!
market players are not dating on FaceBook and make a deal to move price one direction.
how this happens. If we can understand the logic then we can react according to that.
Chikot posted:
Steve, I was reading one guy at Oanda. He back tested 2 ema's against 3 and told 2 ema's show better results.
forex_trader_79941
Member Since Jun 06, 2012
1434 posts
Jun 30, 2012 at 22:56
(edited Jun 30, 2012 at 23:08)
I had a chance to code the MA pattern system. but should used 4.5 pip Range Bars to get patterns more clear for coding.
this has 10 pip Tp and 18 pip Sl. 1/1.8 R/R ratio which is verg good for an EA
this has 10 pip Tp and 18 pip Sl. 1/1.8 R/R ratio which is verg good for an EA
forex_trader_79941
Member Since Jun 06, 2012
1434 posts
Jul 01, 2012 at 20:12
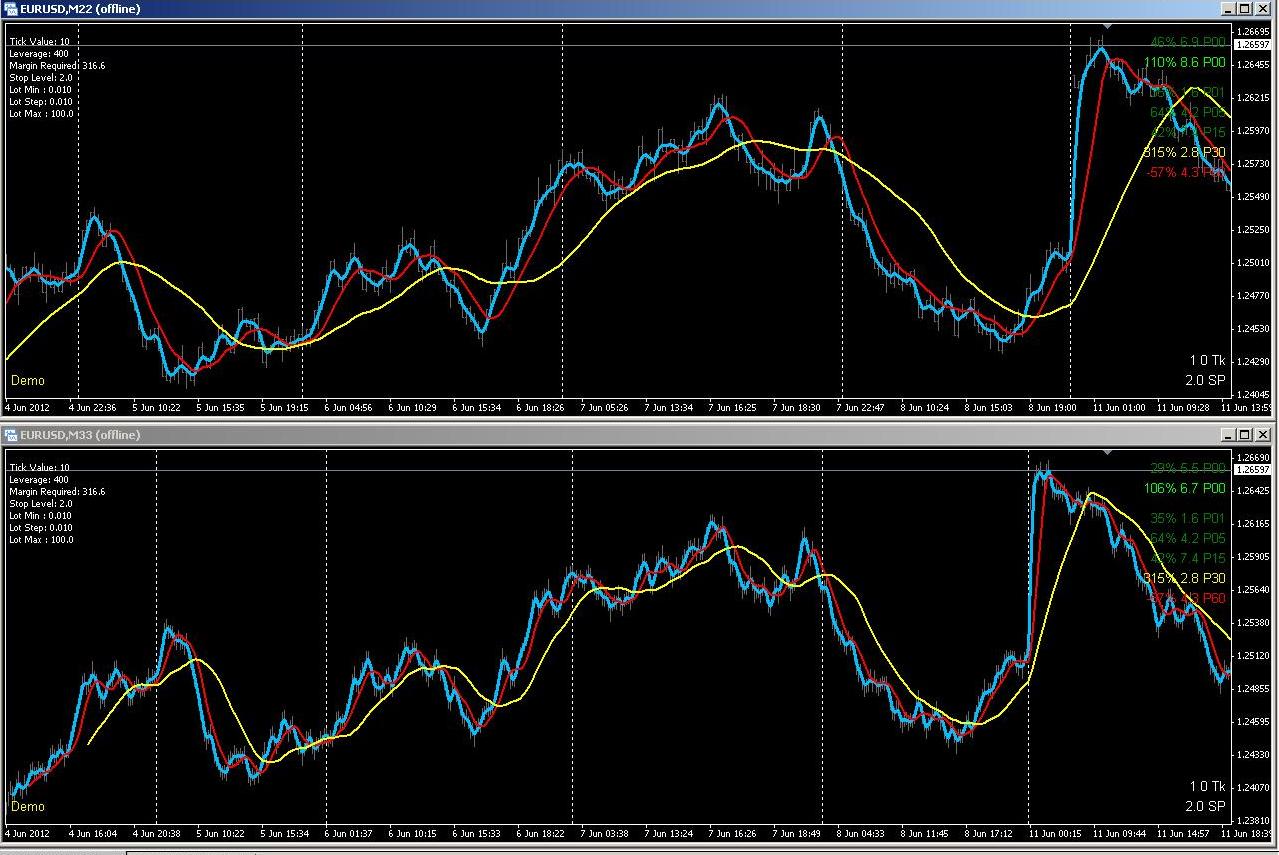
attached there is 2 charts
above is 10 pip range bar but with variable according to the market condition
below 10 pip fix range bar
see how it filters the unneccesery movements
above is 10 pip range bar but with variable according to the market condition
below 10 pip fix range bar
see how it filters the unneccesery movements
forex_trader_79941
Member Since Jun 06, 2012
1434 posts
Jul 16, 2012 at 15:41
at last I learned "Sit and Wait"
now I am working on a system based on US Open Hours combined with patterns.
when I checked the history E/U 1 Hr mainly price is coiled around the US Open hours due to high liquidity and high impact news.
to day I had strat trading with 1 Hr chart based on system.
will post the results.
pattern trading still goes on smaller time frames.
walker
forex_trader_79941
Member Since Jun 06, 2012
1434 posts
Jul 16, 2012 at 15:44
forex_trader_79941
Member Since Jun 06, 2012
1434 posts
Jul 16, 2012 at 15:47
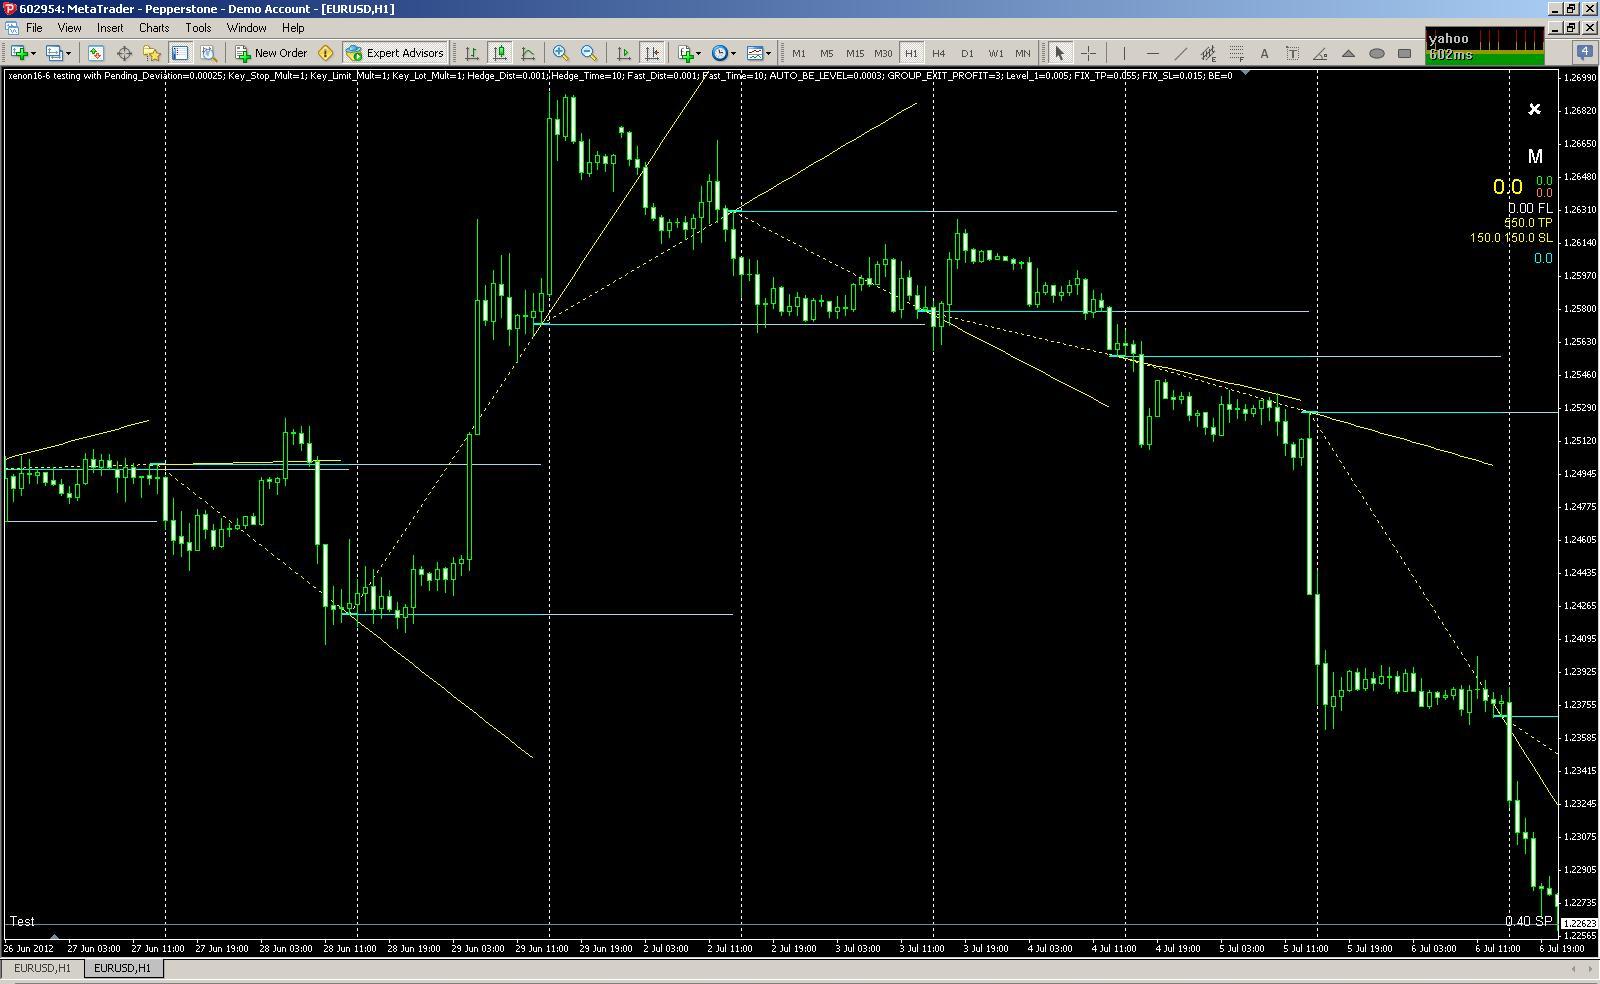
this is mainly 1 trade a day, using last 3 days US Open levels as support and resistance + price action + patterns.
forex_trader_79941
Member Since Jun 06, 2012
1434 posts
Jul 16, 2012 at 15:49
entry
forex_trader_79941
Member Since Jun 06, 2012
1434 posts
Jul 16, 2012 at 15:50
exit +30 pip

Member Since Jan 14, 2010
541 posts
Jul 17, 2012 at 11:09
stevewalker posted:
Quite hard to understand your charts without an explanation 😄
Are those support/resistance levels? Do you draw it manually or is it an indicator?
forex_trader_79941
Member Since Jun 06, 2012
1434 posts
Jul 17, 2012 at 13:21
still working on it.
lets see if its work.
Horizatal Blue lines are Support and resistance. one line for both.
lets see if its work.
Horizatal Blue lines are Support and resistance. one line for both.
forex_trader_79941
Member Since Jun 06, 2012
1434 posts
Jul 17, 2012 at 13:22
todays long entry