


Advertisement
EUR/USD

Jan 05, 2016からメンバー
1097 投稿
Jul 27, 2017 at 21:01
I still say it's going to go back up. There's too much negative political tension to keep the USD strong. I'm still long on the USD, I just added an additional Long trade into this pullback. My target is still 1.1820
If it looks too good to be true, it's probably a scam! Let the buyer beware.
Jul 28, 2017 at 12:34
The single currency recorded a decline against the US dollar on Thursday. The currency pair opened at 1.1733 and finished 58 pips lower. The price managed to break the first support at 1.1700 and if the direction of the traffic went down, there would likely be a breakthrough in the next support at 1.1520.

Oct 02, 2014からメンバー
905 投稿
Jul 28, 2017 at 12:46
Multi-year high for the Euro. I guess this turned out to be the year of the Euro after all.
Positivity

Jul 10, 2014からメンバー
1114 投稿
Jul 28, 2017 at 16:18
arigoldman posted:
Multi-year high for the Euro. I guess this turned out to be the year of the Euro after all.
Indeed. Let's see whether it will break out above the last high at 1.1775 and continue rallying.


forex_trader_445428
Jul 19, 2017からメンバー
83 投稿
Jul 30, 2017 at 06:33
1.1660 will not be an important SUPPORT or RESISTANCE they told me... haha. That is an awful lot of basing for the recent action off/arround 1.1660 right?
I like the downside SHORT case, but it looks right now like it is basing on 1.1660 to go up above 1.16840 and higher. Right? Or maybe I'm just too used to BULL-magaddeon we have been seeing...
I like the downside SHORT case, but it looks right now like it is basing on 1.1660 to go up above 1.16840 and higher. Right? Or maybe I'm just too used to BULL-magaddeon we have been seeing...
forex_trader_445428
Jul 19, 2017からメンバー
83 投稿
Jul 30, 2017 at 06:43
Very good US GDP data expected in less than 1 hour Gross Domestic Product Annualized 1.4% Previous 2.6% Consensus.
If the consensus is confirmed, it's possible 1.15xxx as weekly close...
If the consensus is confirmed, it's possible 1.15xxx as weekly close...

Jul 22, 2013からメンバー
123 投稿
Jul 31, 2017 at 06:16
target at -
1,2100
signal at d5 TF ...
付属品:
SNF-Complex system - build in 2007 \ Tested from 1970.
forex_trader_445428
Jul 19, 2017からメンバー
83 投稿
Jul 31, 2017 at 06:32
Long 1.1735

Jul 31, 2017 at 06:53
On the last Friday’s session the EURUSD rose with a narrow range and closed near the high of the day, however the currency pair closed within Thursday’s range, which suggests being slightly on the bullish side of neutral.
The currency pair is trading above the 10, 50, and 200-day moving averages that should provide dynamic support.
The key levels to watch are: a daily resistance at 1.1829, other daily resistance at 1.1753, the 10-day moving average at 1.1649 (support), a daily support at 1.1460 and other daily support at 1.1556.
"I trade to make money not to be right."
forex_trader_445428
Jul 19, 2017からメンバー
83 投稿
Jul 31, 2017 at 08:20
If you are tracking EURUSD for trading opportunity this week, you may like to consider my top-down technical outlook on the pair.
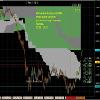
The pair has been operating in a multi-year consolidation pattern or range (bound by two magenta coloured horizontal lines) for a long while. On the weekly time frame, five price waves have formed within the range, beginning from March 15, 2015. The most recent price wave pierced the distal part of the range and last week moved about 80 pips above it. However, sellers intervened and price action yielded some ground ending with less than 60 pips above the distal part, around the 1.17485 area. Furthermore, price action is respecting a support trendline (chocolate colour) from the low of May 2017. Should buyers regain control, a likely target is the immediate resistance around the 1.18700 area. Otherwise, we may see sellers push price action southward, perhaps to target the immediate support around the 1.16680 area or by extension a retest of the support trendline (chocolate colour).
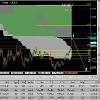
On the H4 time frame, price action has moved above the support trendline seen on the weekly time frame and is operating in an ascending channel (bound by two navy coloured lines). Last week, price action within the channel was largely ambivalent or sideways around the distal end of the channel. Apparently momentum for a bullish drive is weakening and we may see a southward turnaround this week, perhaps to target the 1.16170 area which is the origin of the most recent rally northward, or by extension the proximal channel line.
I may be wrong. Trade safe and prosper.
The pair has been operating in a multi-year consolidation pattern or range (bound by two magenta coloured horizontal lines) for a long while. On the weekly time frame, five price waves have formed within the range, beginning from March 15, 2015. The most recent price wave pierced the distal part of the range and last week moved about 80 pips above it. However, sellers intervened and price action yielded some ground ending with less than 60 pips above the distal part, around the 1.17485 area. Furthermore, price action is respecting a support trendline (chocolate colour) from the low of May 2017. Should buyers regain control, a likely target is the immediate resistance around the 1.18700 area. Otherwise, we may see sellers push price action southward, perhaps to target the immediate support around the 1.16680 area or by extension a retest of the support trendline (chocolate colour).
On the H4 time frame, price action has moved above the support trendline seen on the weekly time frame and is operating in an ascending channel (bound by two navy coloured lines). Last week, price action within the channel was largely ambivalent or sideways around the distal end of the channel. Apparently momentum for a bullish drive is weakening and we may see a southward turnaround this week, perhaps to target the 1.16170 area which is the origin of the most recent rally northward, or by extension the proximal channel line.
I may be wrong. Trade safe and prosper.
Jul 10, 2014からメンバー
1114 投稿
Jul 31, 2017 at 16:42
Not only did EUR/USD rally again today, but it finally broke out both above the previous high at 1.1775 and above 1.1800. The trend is very bullish and there are no major resistance levels on the way up.
Jul 22, 2013からメンバー
123 投稿
Aug 01, 2017 at 06:33
final target on my system is 1,21 ... 1,2 ...
then we go slow back to ~1,1
SNF-Complex system - build in 2007 \ Tested from 1970.
Jul 22, 2013からメンバー
123 投稿
Aug 01, 2017 at 06:34
long term targets ...
付属品:
SNF-Complex system - build in 2007 \ Tested from 1970.


