


Advertisement
EUR/USD
Dec 10, 2017からメンバー
210 投稿
Sep 27, 2018 at 12:38
EUR/USD: Yesterday's rate hike wasn't a big surprise - it was almost fully calculated in the price of the pair. But, today's 2,3 German inflation is another thing - I wonder how would markets interpret the data...

Jul 10, 2014からメンバー
1114 投稿
Sep 27, 2018 at 18:03
The pair is very bearish after the fundamentals yesterday. It is currently testing the support at 1.1660 and if it breaks out below that level it may continue falling towards 1.1600.

Sep 25, 2018からメンバー
8 投稿
Sep 28, 2018 at 05:45
Hi, Traders!
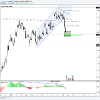
Before we push higher we still looking for target zone 1.1625 (25 pips lower). Yesterday price drop for more than 100 pips after there was a hidden MACD divergence formed with triangle breakout.
Best regards,
Before we push higher we still looking for target zone 1.1625 (25 pips lower). Yesterday price drop for more than 100 pips after there was a hidden MACD divergence formed with triangle breakout.
Best regards,
付属品:
Trading, Golf
Dec 10, 2017からメンバー
210 投稿
Sep 28, 2018 at 06:32
1.1633 is an important support level for EUR/USD. If the pair manages to pierse it, the next target is 1.1600.

Sep 28, 2018 at 09:30
On yesterday session, the EURUSD dived with a wide range and closed near the low of the day, in addition, managed to close below Wednesday’s low, which suggests a strong bearish momentum.
The currency pair is trading above the 50-day moving average, that should provide a dynamic support but closed below the 10-day moving average that should provide a dynamic resistance, nonetheless, it continues to trade below the 200-day moving averages that should provide dynamic resistance.
The key levels to watch: daily resistance at 1.1829, 61.8 Fibonacci expansion at 1.1795 (resistance), daily resistance at 1.1753, a key level at 1.1684 (resistance), the 10-day moving average at 1.1710 (resistance), the 50-day moving average at 1.1592 (support) and a daily support at 1.1555.
"I trade to make money not to be right."

Oct 02, 2014からメンバー
905 投稿
Sep 28, 2018 at 11:31
The Euro lost a lot this week, with no important data I think the direction will continue to point South at the most until the NFPs next Friday.
Positivity
Oct 01, 2018 at 10:07
On the last Friday’s session, the EURUSD initially fell but found enough buying pressure near 1.1570 to trim some of its losses and close in the middle of the daily range, in addition, managed to close below Thursday’s low, which suggests a bearish momentum.
The currency pair is trading above the 50-day moving average, that should provide a dynamic support but closed below the 10-day moving average that should provide a dynamic resistance, nonetheless, it continues to trade below the 200-day moving averages that should provide dynamic resistance.
The key levels to watch: daily resistance at 1.1829, 61.8 Fibonacci expansion at 1.1795 (resistance), daily resistance at 1.1753, a key level at 1.1684 (resistance), the 10-day moving average at 1.1699 (resistance), the 50-day moving average at 1.1594 (support) and a daily support at 1.1555.
"I trade to make money not to be right."
Oct 01, 2018 at 15:46
EUR/USD had a bearish momentum last week, making the bottom at 1.1569. The downward rally was triggered by the bearish pin bar at the daily EMA 200, formed on September 24, but stopped at the trendline. The outlook is descending to test 1.1530 in a near perspective. A clear breakthrough and daily closure below this zone could open the doors to 1.1430 before the target in the 1.1300 area this week. The first resistance is 1.1650, whose breakthrough may interrupt the bear phase. But the longer the couple stays below 1.1725, I prefer the bearish scenario.
Oct 02, 2018 at 10:01
On yesterday session, the EURUSD tried to rise with a narrow range but found enough selling pressure near 1.1625 to erase all of its gains and closed near the low of the day, however, closed within Friday’s range, which suggests being slightly on the bearish side of neutral.
The currency pair is trading below the 10 and the 50 and the 200-day moving averages, all should provide a dynamic resistance.
The key levels to watch: daily resistance at 1.1829, 61.8 Fibonacci expansion at 1.1795 (resistance), daily resistance at 1.1753, a key level at 1.1684 (resistance), the 10-day moving average at 1.1667 (resistance), the 50-day moving average at 1.1592 (resistance), a daily support at 1.1555 and other daily support at 1.1459.
"I trade to make money not to be right."
Oct 02, 2014からメンバー
905 投稿
Oct 02, 2018 at 12:24
The Euro dipped a lot today. I'd be looking to go long at 1.14-1.1390.
Positivity
Sep 26, 2018からメンバー
9 投稿
Oct 02, 2018 at 12:46
No upwards movement so far today and not even pausing at resistance levels. I can see a break below 1.15 later today. If there is any kind of short term reversal upwards then a I will be going short

Sep 12, 2015からメンバー
1933 投稿
Oct 02, 2018 at 14:35
Making some progress to the upside,Long off 15200,stop at 15100
"They mistook leverage with genius".
Dec 10, 2017からメンバー
210 投稿
Oct 02, 2018 at 14:57
Euro/usd found support at 1.1500.
Sep 12, 2015からメンバー
1933 投稿
Oct 02, 2018 at 15:06
15700 next stop for support area to carry higher or shorts will pile in again to take us lower.
"They mistook leverage with genius".
Sep 12, 2015からメンバー
1933 投稿
Oct 02, 2018 at 15:11
Hawkish talk from Villeroy ,the question is how long will it last is anyone's guess.
"They mistook leverage with genius".
Oct 03, 2018 at 10:01
On yesterday session, the EURUSD initially fell with a wide range but found enough buying pressure near 1.1505 to trim some of its losses and closed in the middle of the daily range, in addition, managed to close below Mondays’ low, which suggests a bearish momentum.
The currency pair is trading below the 10 and the 50 and the 200-day moving averages, all should provide a dynamic resistance.
The key levels to watch: daily resistance at 1.1829, 61.8 Fibonacci expansion at 1.1795 (resistance), daily resistance at 1.1753, a key level at 1.1684 (resistance), the 10-day moving average at 1.1653 (resistance), the 50-day moving average at 1.1593 (resistance), a daily support at 1.1555 and other daily support at 1.1459.
"I trade to make money not to be right."


