


Advertisement
Gold
Jan 10, 2017 at 09:52
Look at this transactions TP is 1300.....:)
https://consiliuminvest.com/strategies/43-long-term-investment
https://consiliuminvest.com/strategies/43-long-term-investment


Oct 02, 2014からメンバー
905 投稿
Jan 13, 2017 at 16:21
Good move this week!
Positivity

Mar 25, 2015からメンバー
70 投稿
Jan 17, 2017 at 15:45
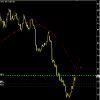
After the reversal in the 3rd week of December, we see now a strong bullish sentiment for the gold against the dollar. Watch out for resistance at 1233 with a good long trade opportunities currently.


forex_trader_252244
May 26, 2015からメンバー
85 投稿
Mar 06, 2017 at 20:40
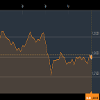
Gold drops below $1230
A stronger US dollar across the board pushed the price of the yellow metal to the downside. The value of the ounce is pulling back on Monday after a having a sharp rally on Friday, from 2-week lows.
XAU/USD reached $1236 at the beginning of the week but then lost strength and started to decline. Recently it broke below the short-term support area around $1230 and fell to $1228 hitting a fresh daily low.
Now the metal is looking at the next support at $1225. Below there attention would turn to Friday’s low at $1222 and then to the $1220 zone. A consolidation below $1220 could open the doors for a test of $1205 - $1200.
To the upside, now $1230 is the immediate resistance. XAU/DUSD needs to rise above the 20-day moving average that stands at $1238 in order to remove the short-term bearish pressure.
Since the beginning of March, gold lost more than $20, amid a recovery of the US dollar supported by expectations of several rate hikes from the Federal Reserve during 2017. For the current year, is still in positive territory, up 7%

Mar 28, 2017 at 06:25
Gold Price Predictions March 2017
XAUUSD is in a bullish trend, and little more upward movement is expecting.We will look for reversal signal from 1263 or 1267-71 level which is weekly trend resistance zone mentioned in a chart below.Current gold price is around 1260.
Yellow metal immediate support level is forming at 1245-47 area, which could be our first bearish target after reversal confirmation.
Please have a look at daily chart below to get the trade idea.
付属品:
dailygoldanalysis1@
Mar 28, 2017 at 08:12
Wow... Totally agree with prediction by Daily Gold Analysis i am monitoring same resistance trendline for years but the resistance trendline need to be seen on weekly or monthly eagle eye level of weekly chart analysis for global looks...Have A Nice Idea of All pairs associated with gold dear..Thank You ..Great Idea Actually.😲😀

forex_trader_338100
Jun 21, 2016からメンバー
287 投稿
Mar 28, 2017 at 09:32
On the upside, $1260 region (200-day SMA) remains immediate strong hurdle, which if cleared decisively is likely to lift the commodity towards $1275 horizontal resistance with some intermediate resistance near $1270 level. Meanwhile on the downside, retracement below $1250 area is likely to find support near $1245 horizontal level, below which the corrective slide could get extended towards $1236-35 support zone.
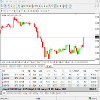
Apr 20, 2017 at 08:56
Yesterday we expected bearish movement with minimum target 1271.Market move lower and bounce from 1274 zone.Current gold price is 1279, It seems bearish bias is still not over and we are still expecting a more bearish move towards minimum 1271 and maximum 1263.
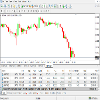
TREND INDEX
Bearish
AVG SELL PRICE
1291.00
AVG BUY PRICE
1248.00
TREND INDEX
Bearish
AVG SELL PRICE
1291.00
AVG BUY PRICE
1248.00
付属品:
Apr 23, 2017 at 07:08
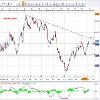
Analysis For 24th April 2017:
Gold prices broke out and are forming a bull flag pattern ahead of Sunday’s Presidential Election. The moved toward safe-haven assets continue to drive gold prices higher. It appears that the elections are a binary event that will drive prices. If Le Pen performs better than expected, gold will likely benefit.
Support is seen near the 10-day moving average at 1,280. Resistance is seen near the November 8, US Election Day highs at 1,337. Momentum has turned neutral as the MACD (moving average convergence divergence) index prints near the zero-index level with a flat trajectory that reflects consolidation.


