


Advertisement
Portfolio > Advance statistics > Hourly
Jul 07, 2023 at 03:05
422 視聴
1 Replies

May 10, 2023からメンバー
1 投稿
Jul 07, 2023 at 03:05
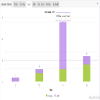
How to Interprete Portfolio > Advance statistics > Hourly
Please Help
Please Help
付属品:


*商用利用やスパムは容認されていないので、アカウントが停止される可能性があります。
ヒント:画像/YouTubeのURLを投稿すると自動的に埋め込まれます!
ヒント:この討論に参加しているユーザー名をオートコンプリートするには、@記号を入力します。


